
Documents index

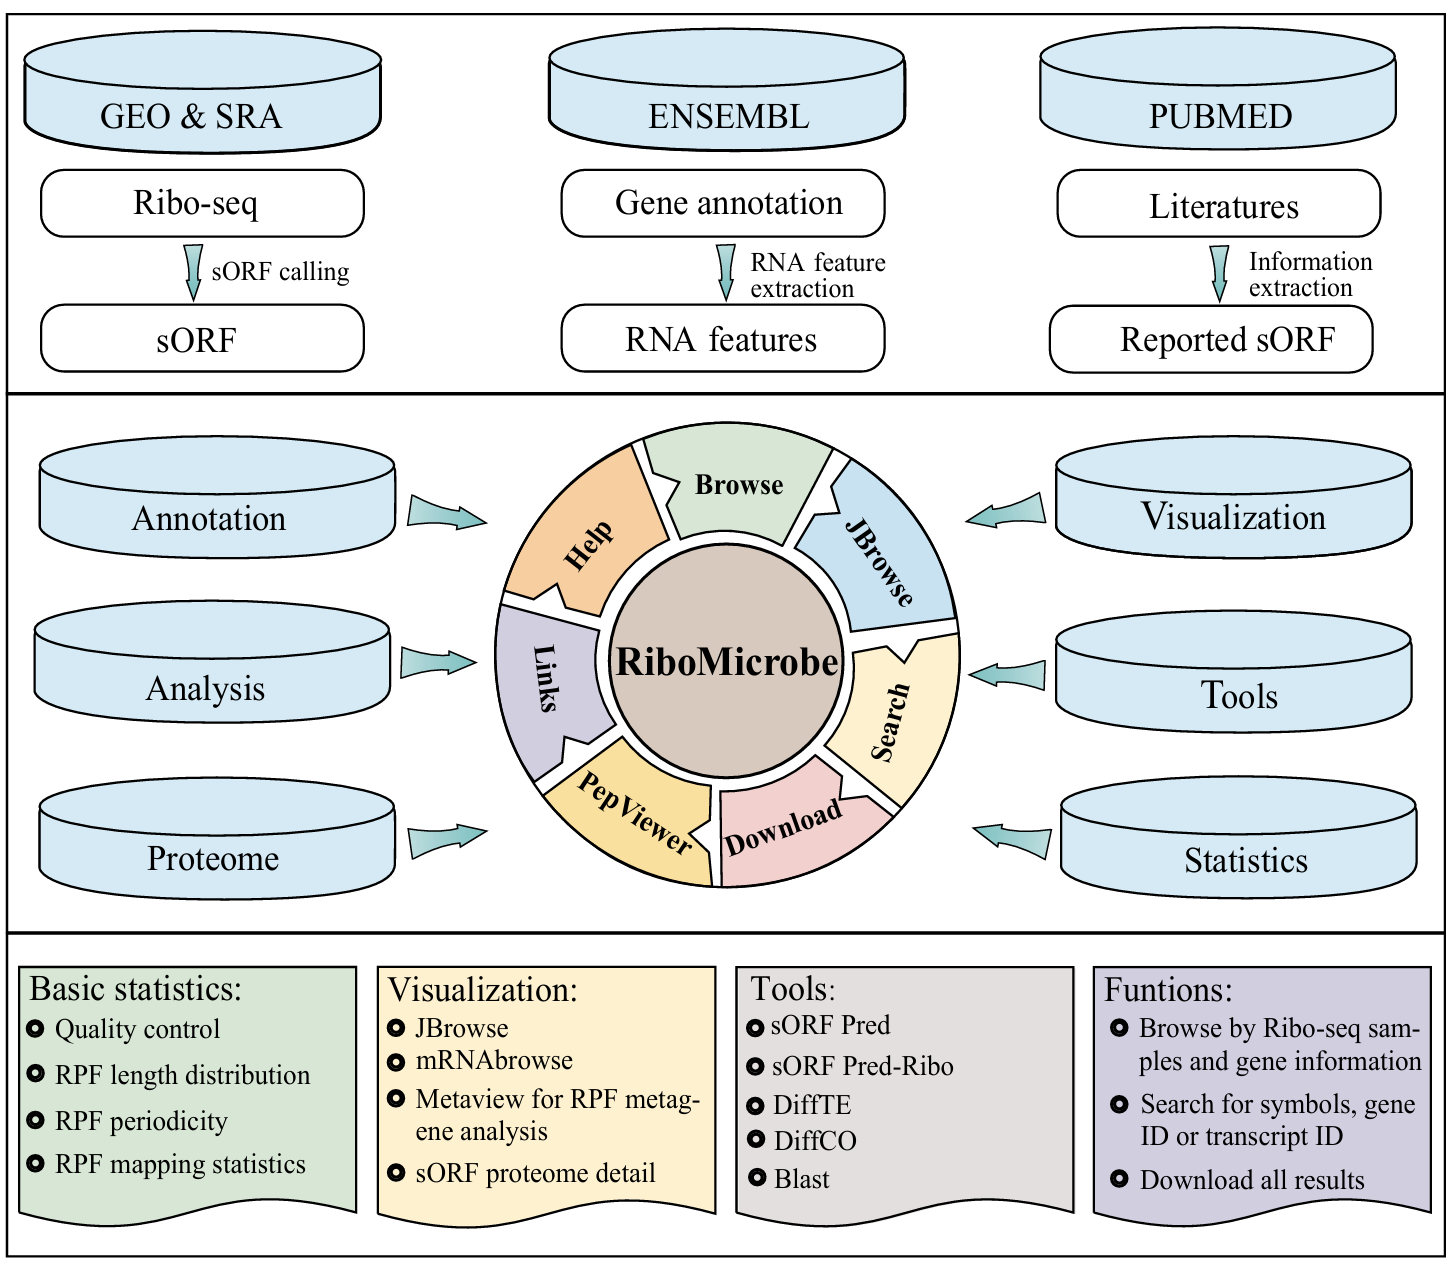
The scheme of the RiboMicrobe workflow: RiboMicrobe provides comprehensive information on microbial Ribo-seq. RiboMicrobe has meticulously collected 891 samples from 38 species from the SRA and GSA databases. All datasets are processed through our unified pipeline, and the generated results are stored in a MySQL database and displayed in a visual browser and web pages.
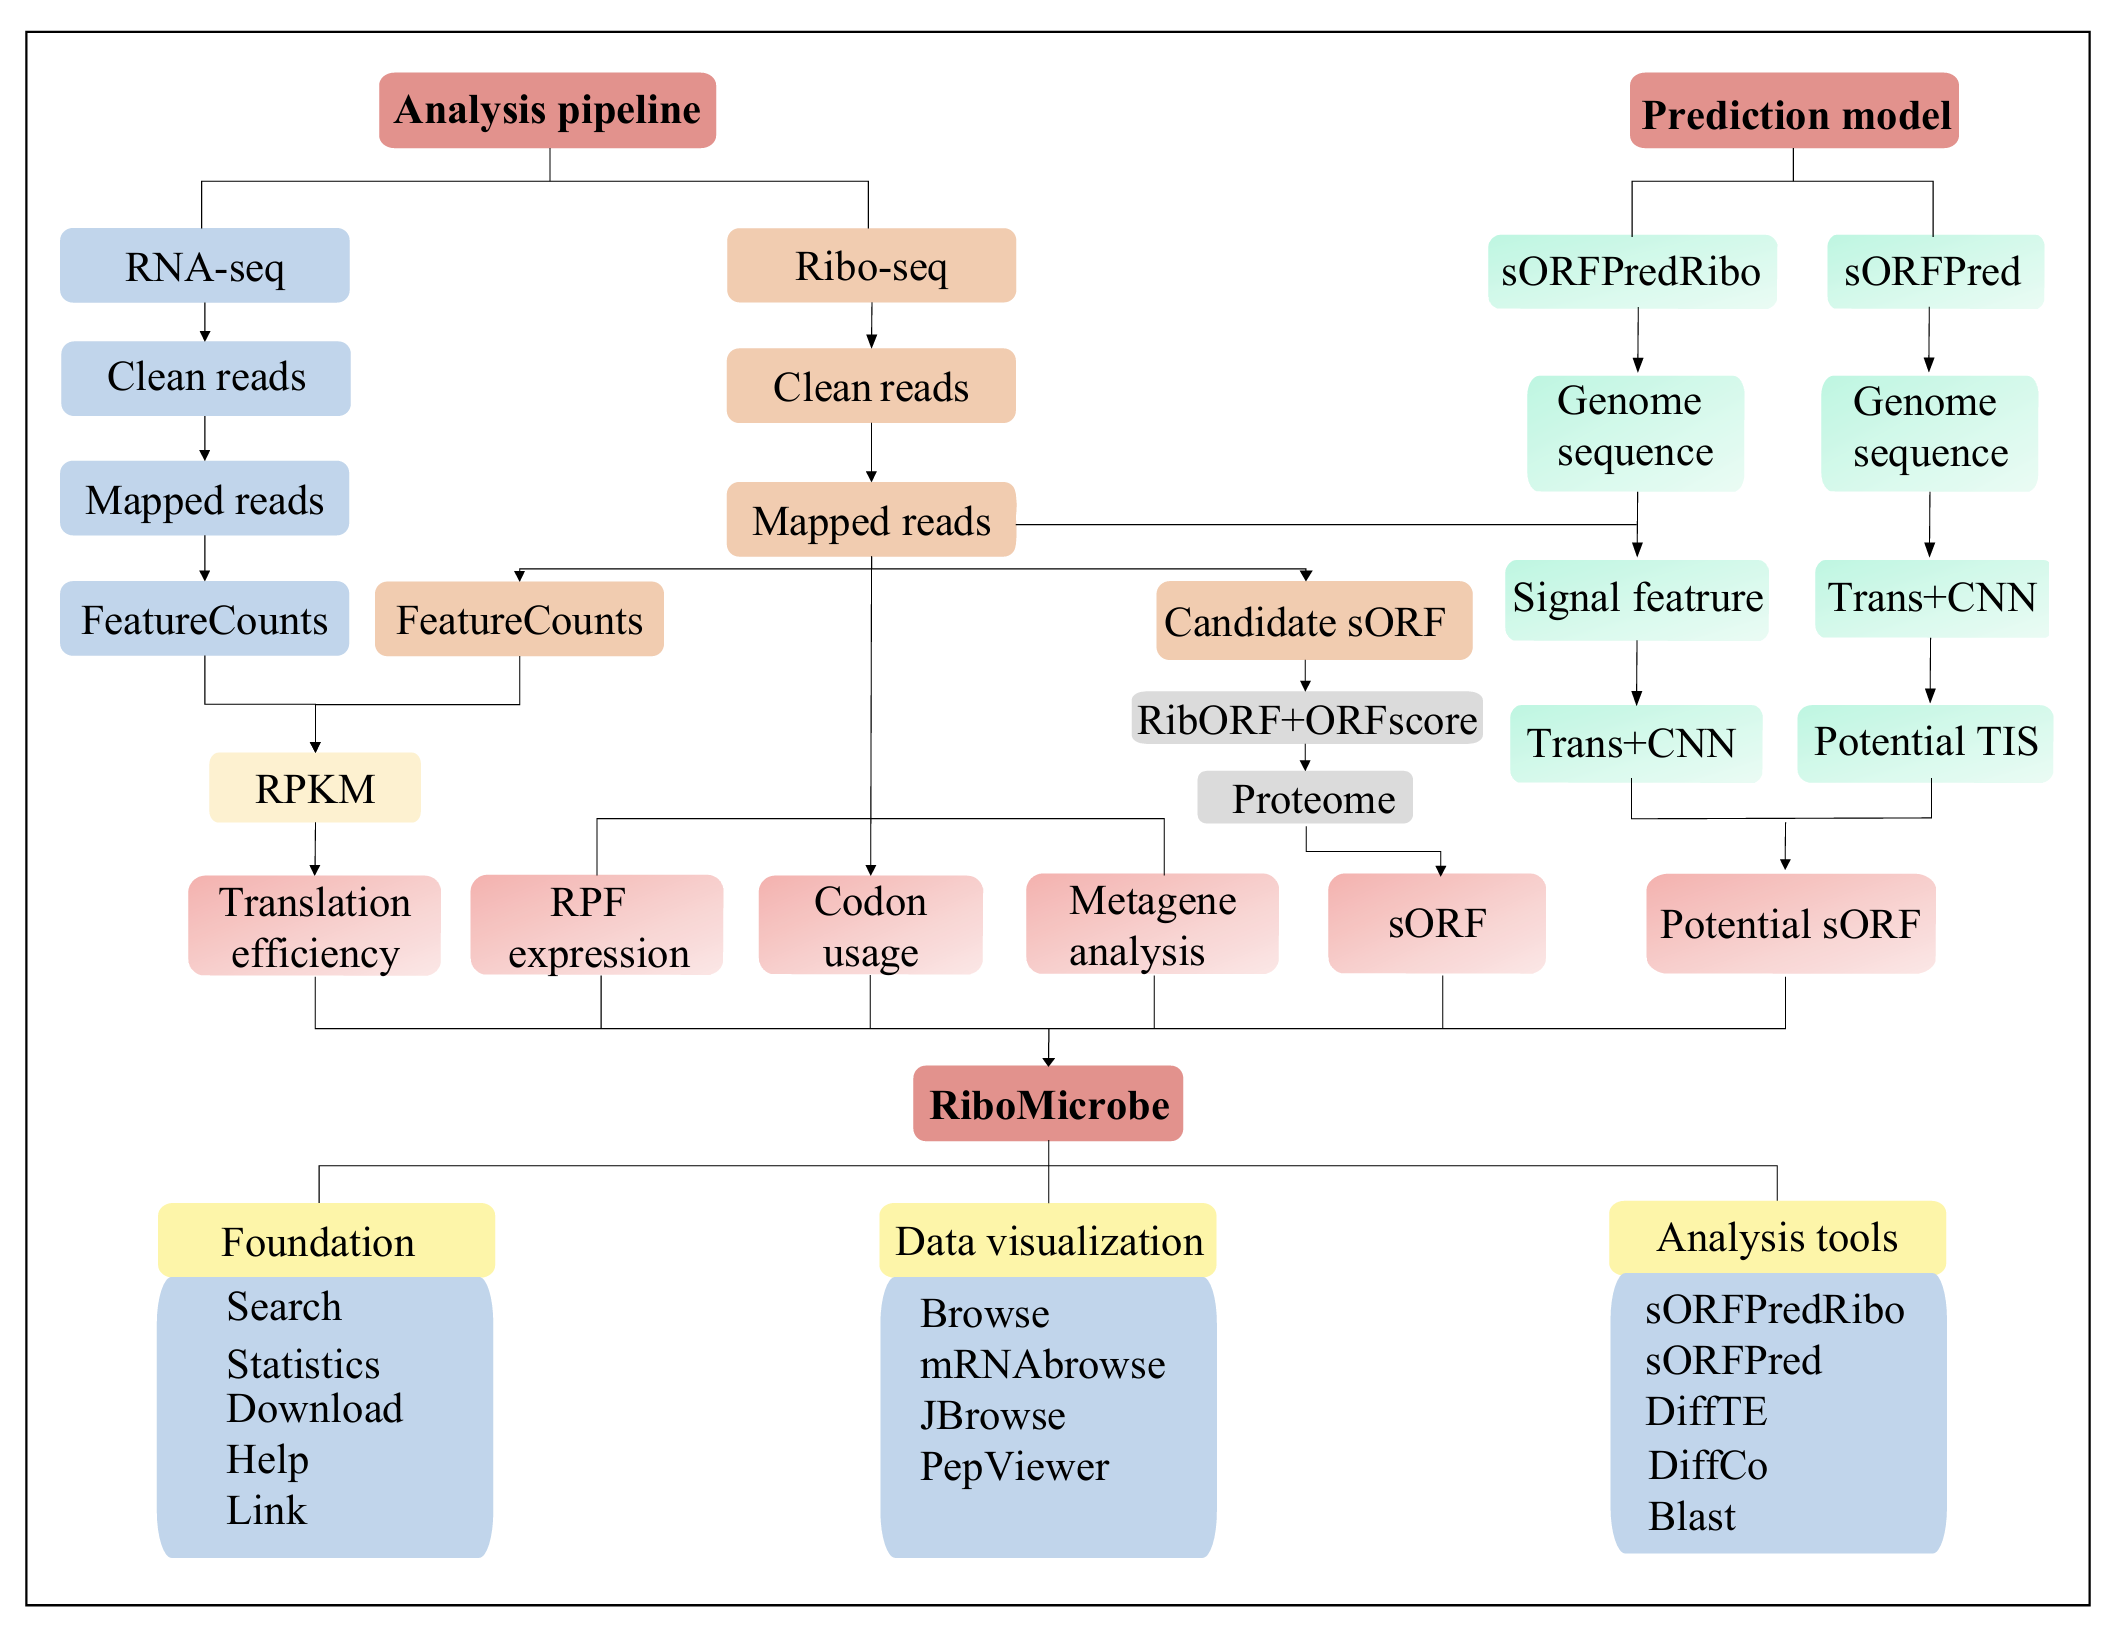
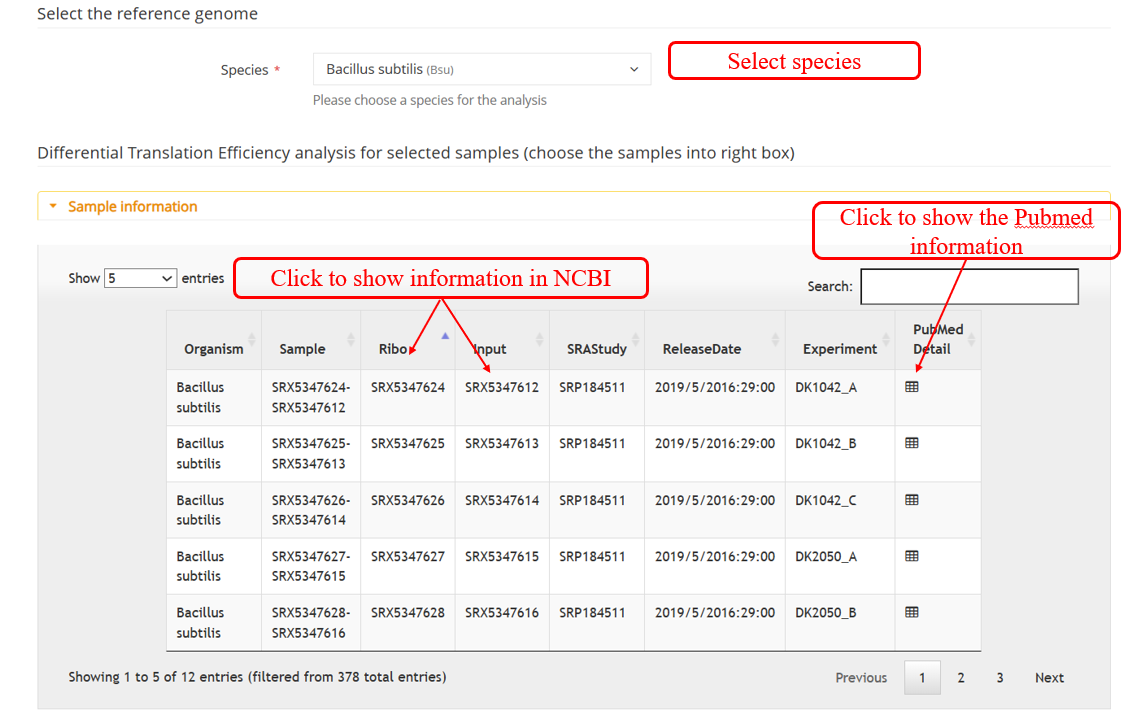
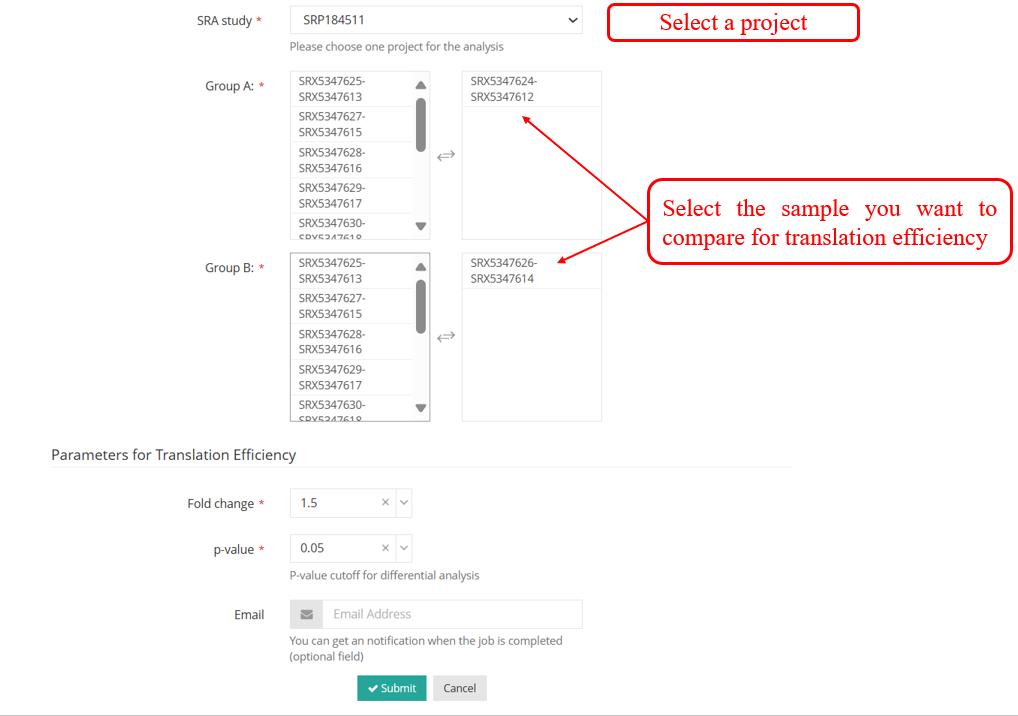
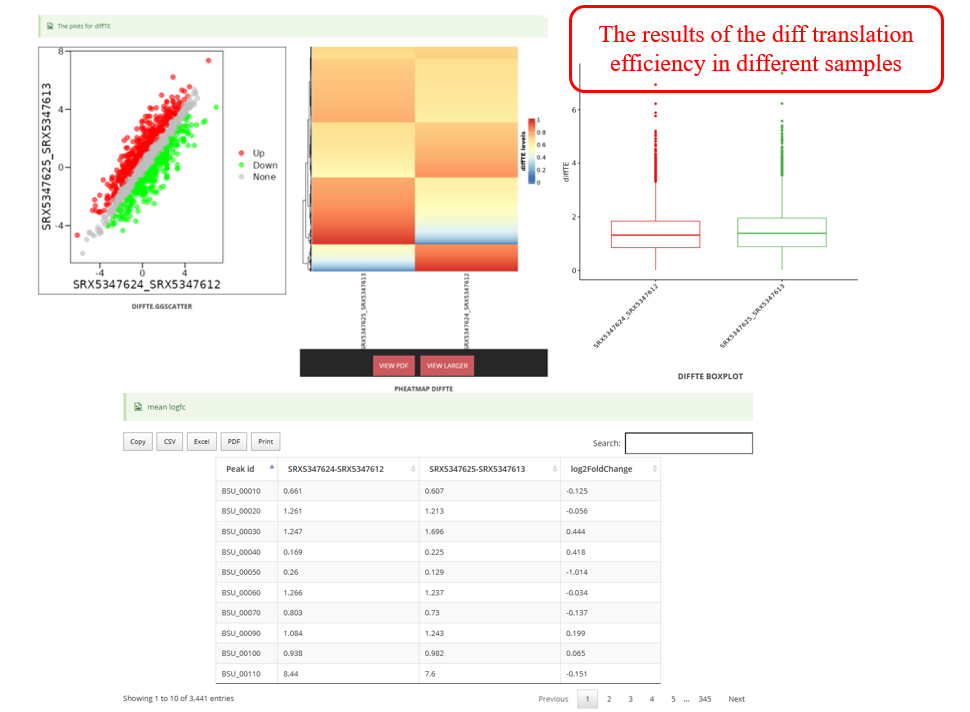
Overall analysis workflow of the RiboMicrobe database. The integrated analytical workflow in RiboMicrobe comprises two core components:analysis pipeline and prediction model. The analysis pipeline mainly relies on ribo-seq data, including translation efficiency, RPF expression, metagene analysis, codon usage, etc. The prediction models include sORFPredRibo and sORFPred. sORFPredRibo is based on sequence and signal features, while sORFPred focuses solely on sequence features.
Web resources have a dependency on internet browsers, and different browsers use different kernels with different approaches. We recommend that users access our database through a Firefox, Chrome or Microsoft Edge browser.
| Browser Name | Supported Version |
|---|---|
| Microsoft Edge | >=112.0.x |
| Firefox | >=116.0.x |
| 360 | >=14.1.x |
| Safari | >=5.1.x |
| Chrome | >=70.0.x |
| Opera | >=101.0.x |
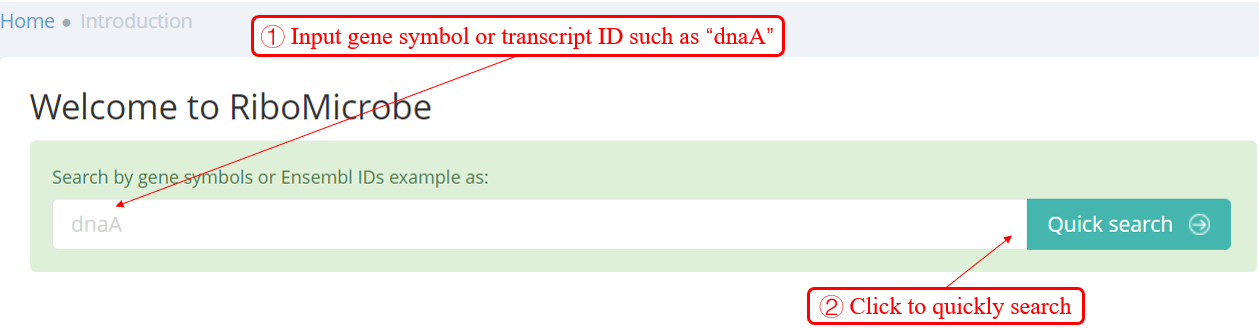
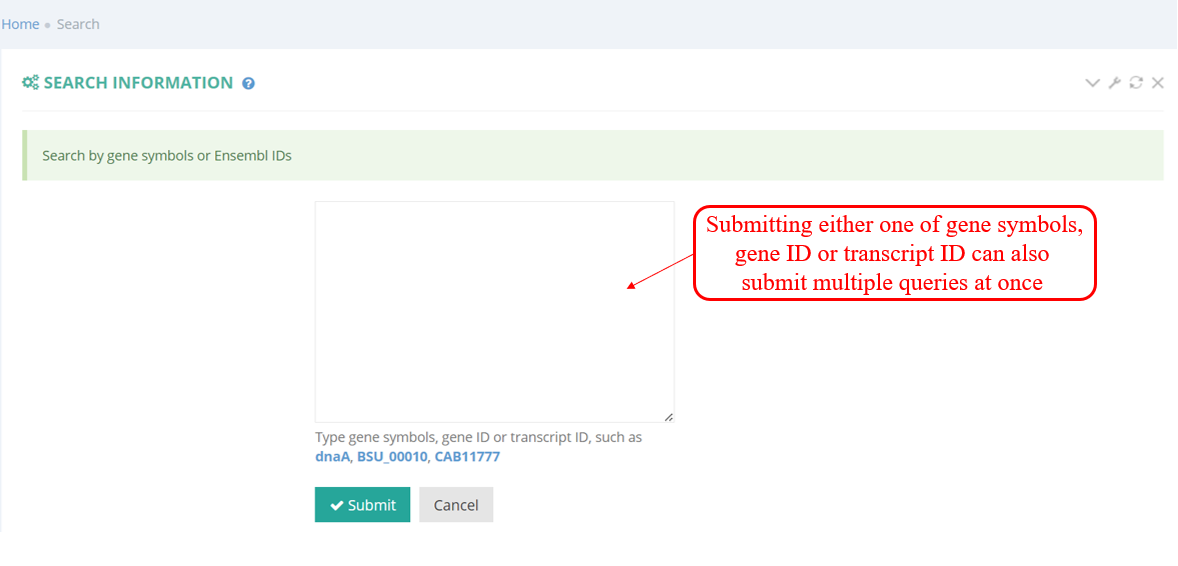
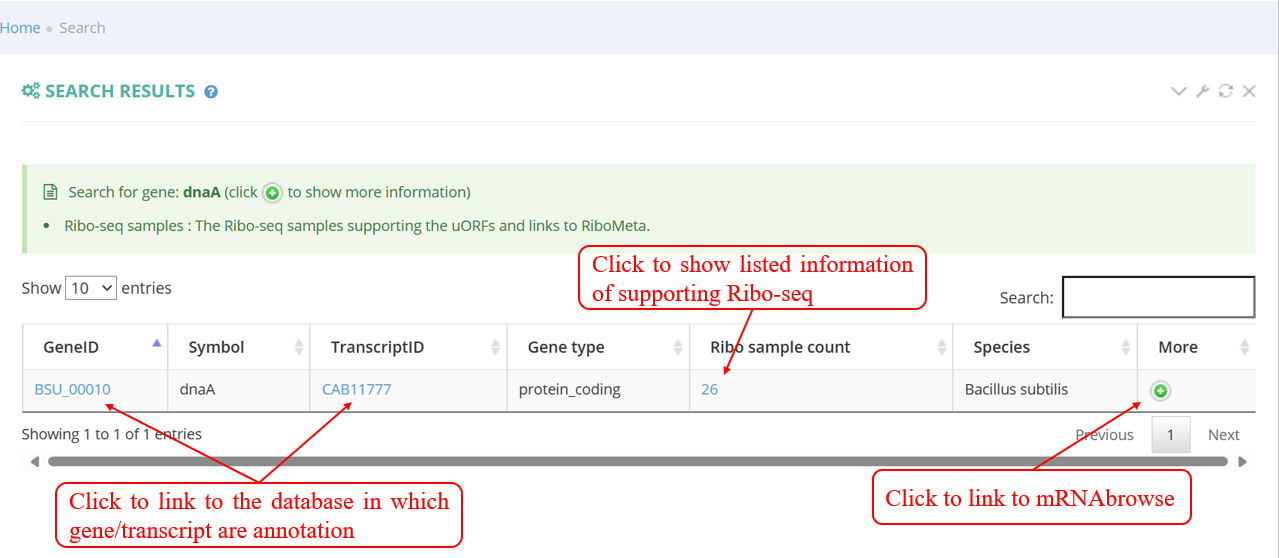
Users can quickly search for the interesting gene symbol or Transcript ID from the homepage. You will see the page shown in the screenshot below. Enter the gene symbol "dnaA" in the Gene/Transcript input box. You can read more about them in a list including the number of candidate sORFs.
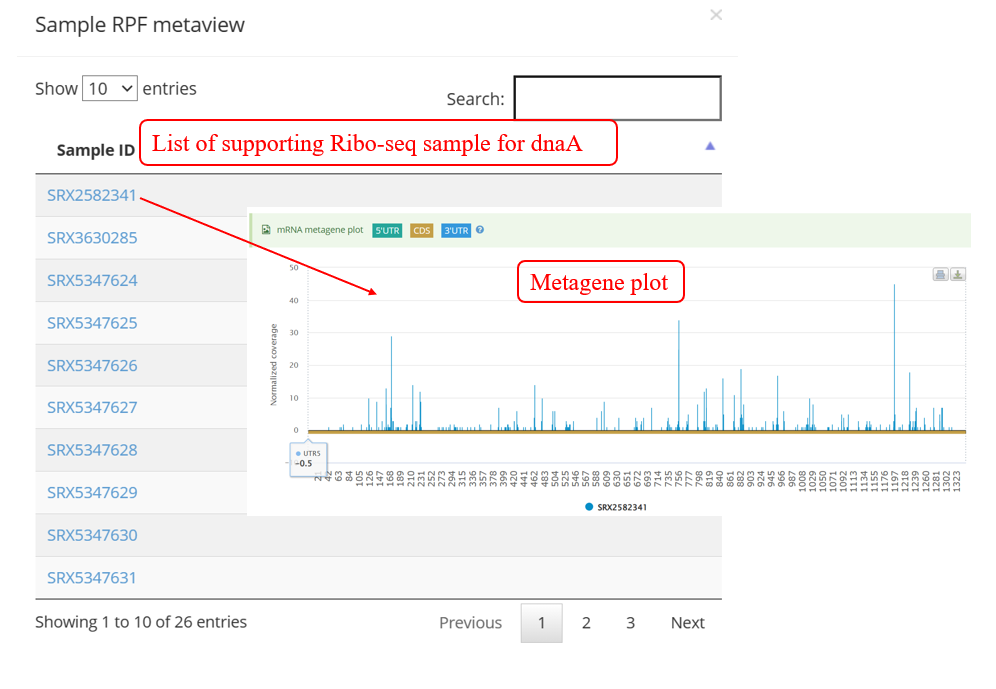
As shown in the screenshot below, the supporting samples page of actively translated ORF lists all supporting samples for a transcript with actively translated sORFs and a link to metagene page. When clicking the button in ‘Metaview’ column, the metagene plot displays the distribution of RPF on 5’ UTR, CDS, and 3’ UTR.
If you don‘t have a specific gene/transcript in mind and are looking specifically for cases of Ribo-seq, you can query these in the ‘Browse module’ which displays the datasets of RiboMicrobe by gene/transcript ID, Ribo-seq as query.
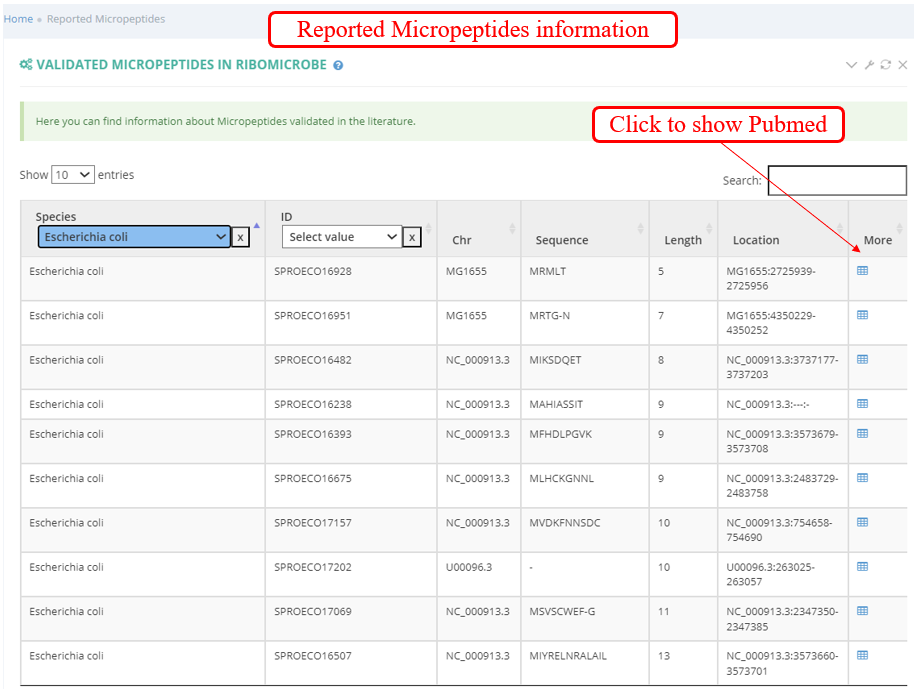
Browse of Validated Micropeptides: you can find information about Micropeptides validated in the literature.
Browse by Ribo-seq samples: The below screenshot shows a list of Ribo-seq samples list including the SRA_ID, description retrieved from NCBI database, links to the analysis result, and scientific name of species.
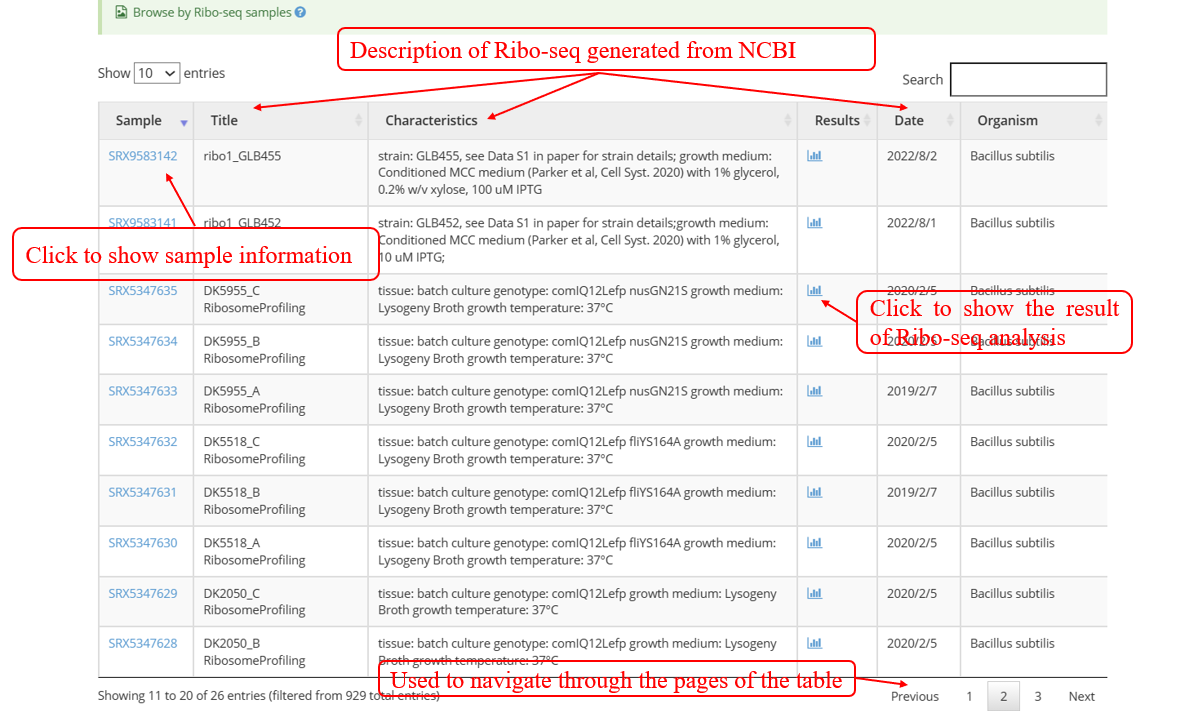
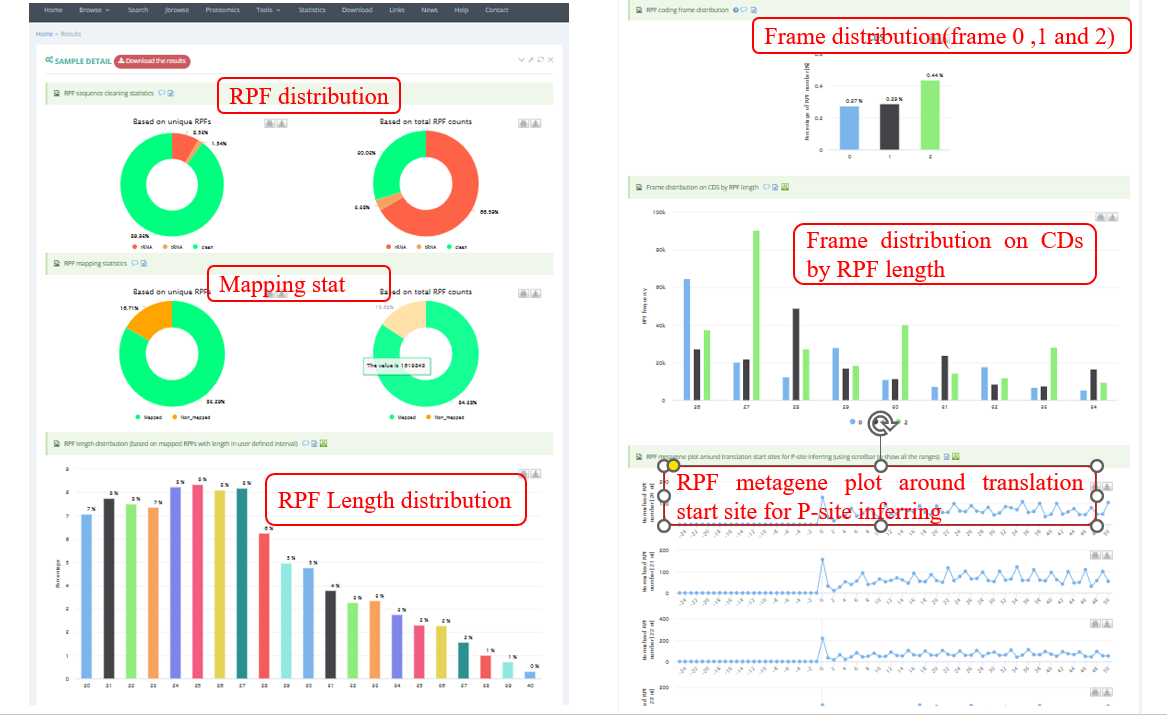
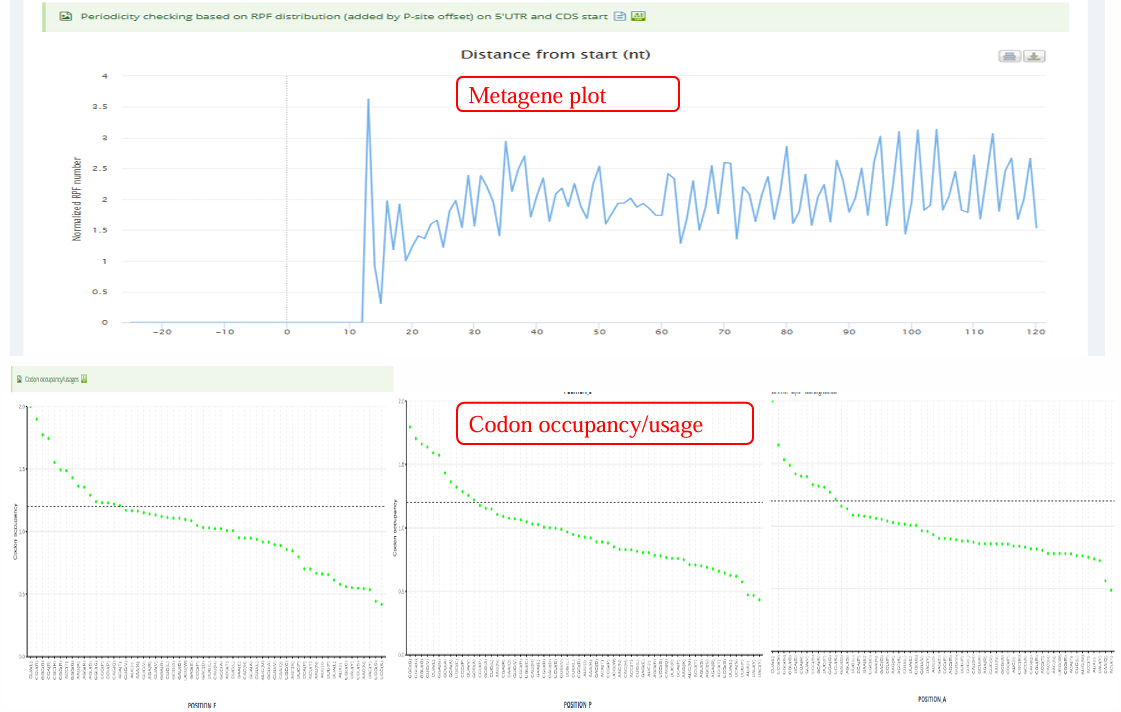
The below screenshot shows an example of the analysis result of a Ribo-seq sample.The ‘Result’ page typically contains the results of quality control for Ribo-seq and sORFs identification.
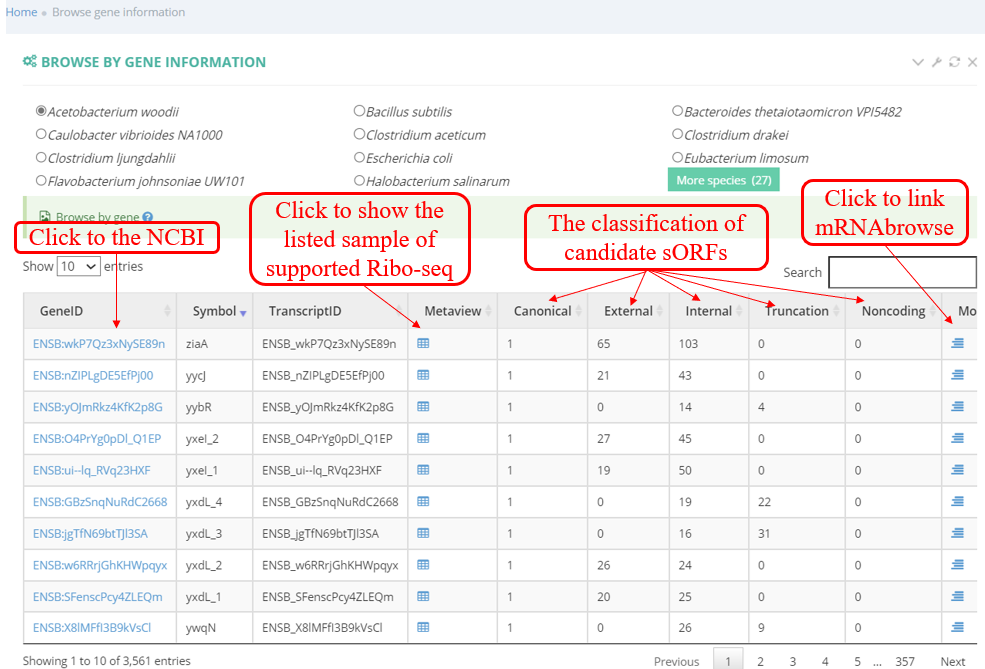
Browse by geneinfo: The below screenshot shows a list of Ribo-seq samples list including the transcript ID, description retrieved from NCBI database, links to the analysis result, and scientific name of species.
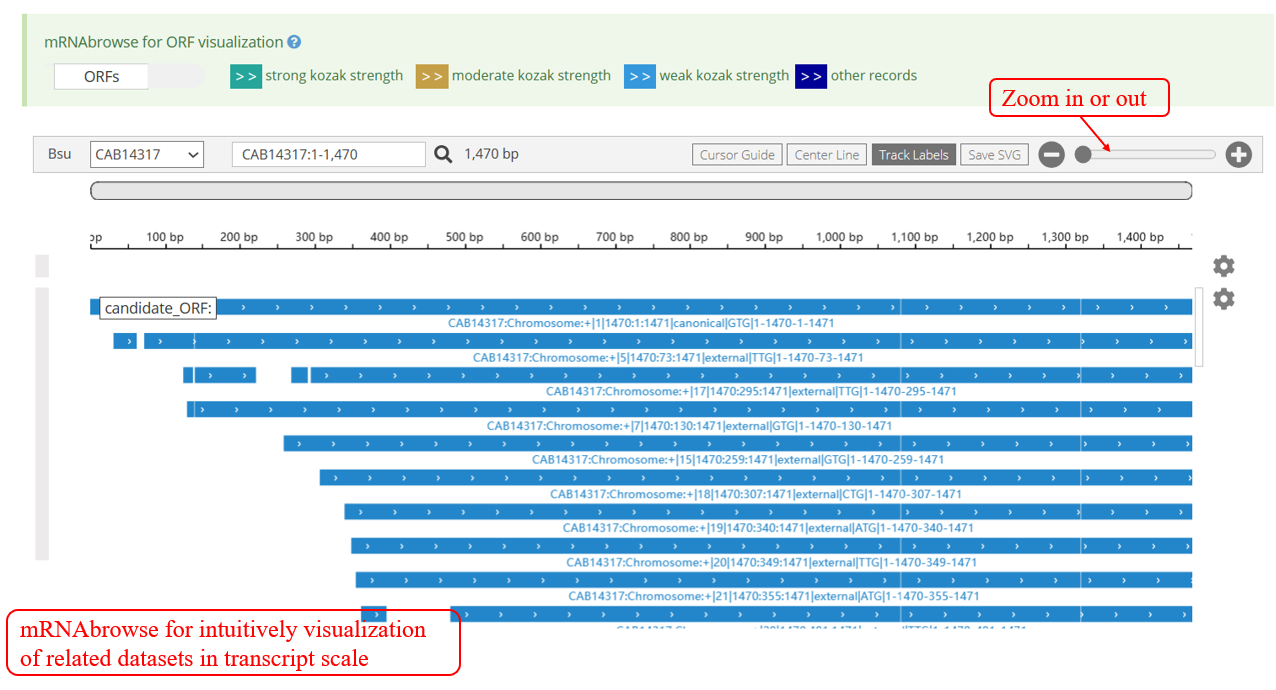
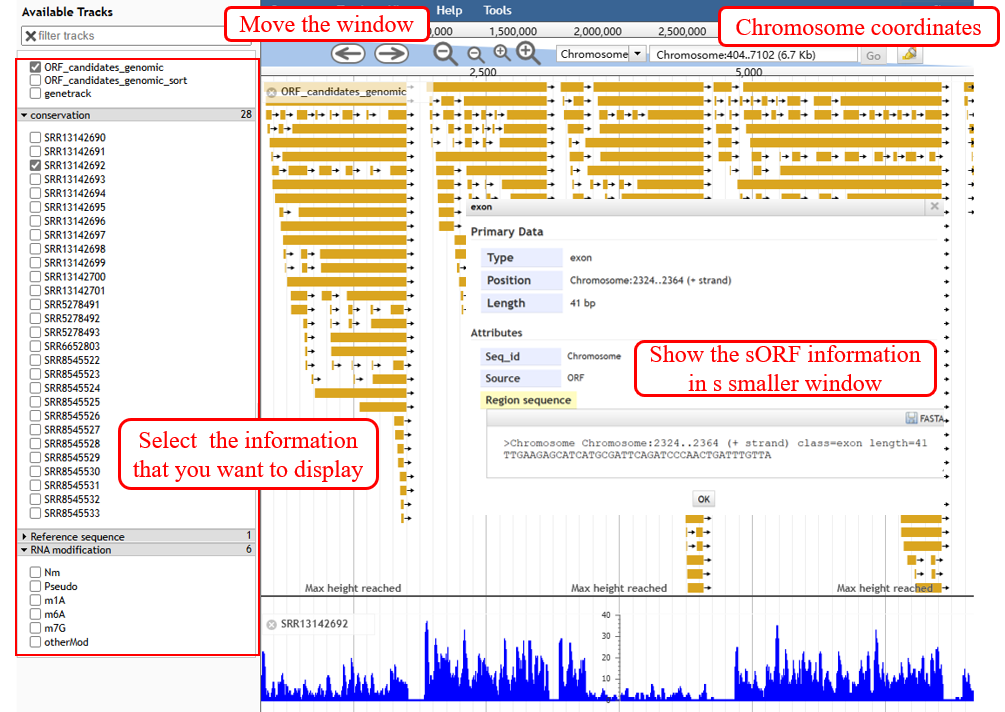
‘Jbrowse’, a comprehensive genomic browser, displays sORFs and their related information with genome coordinates.
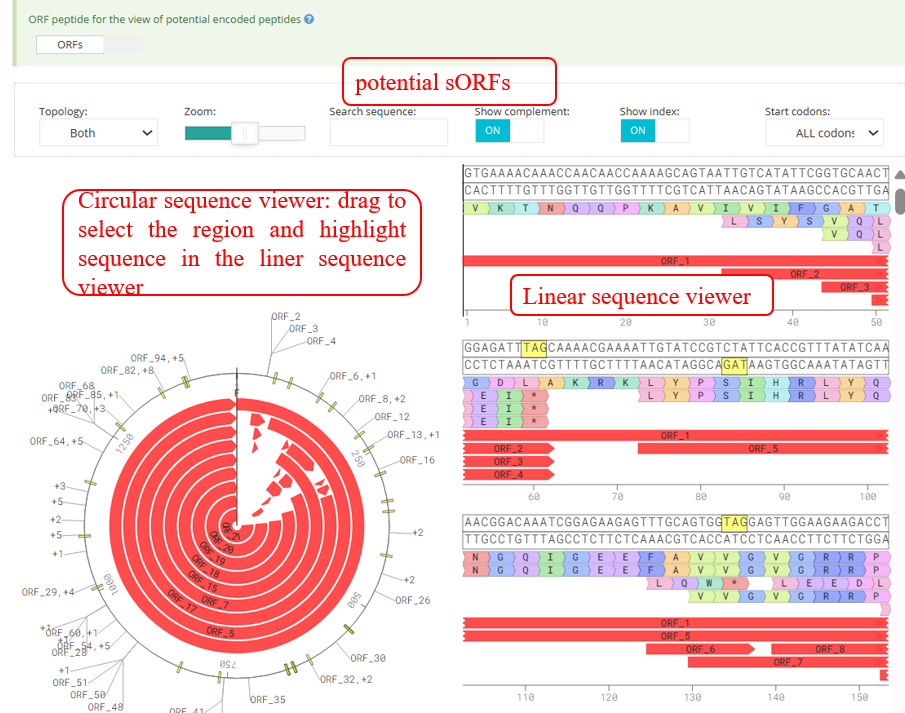
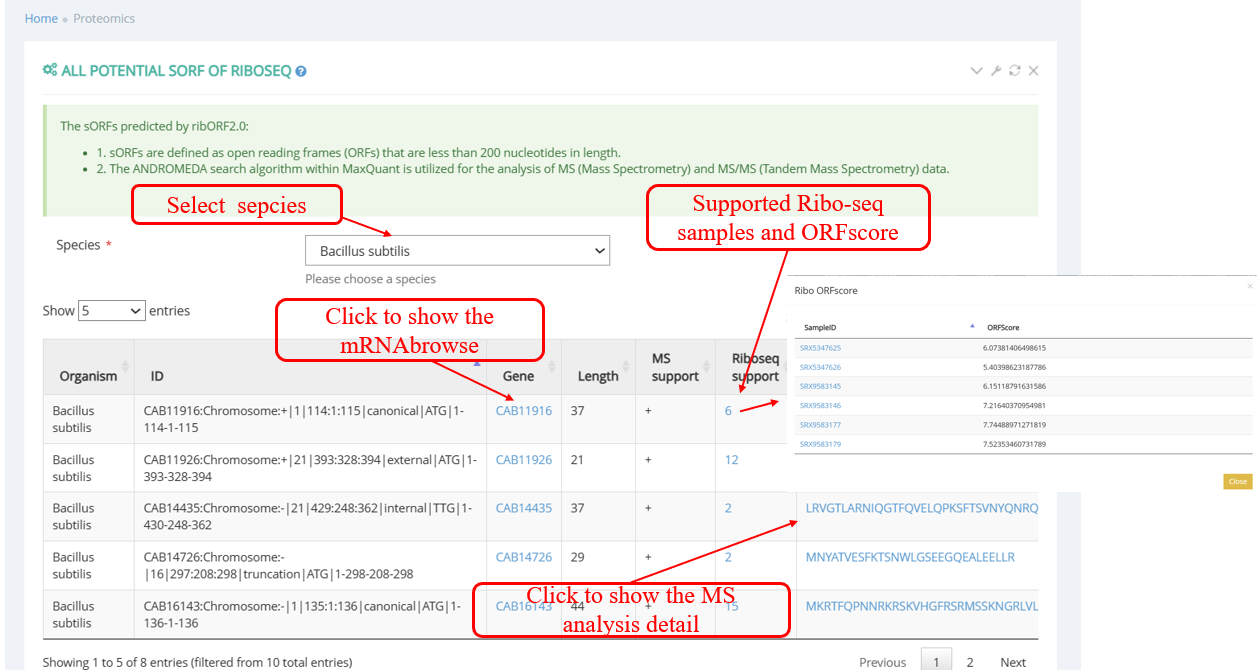
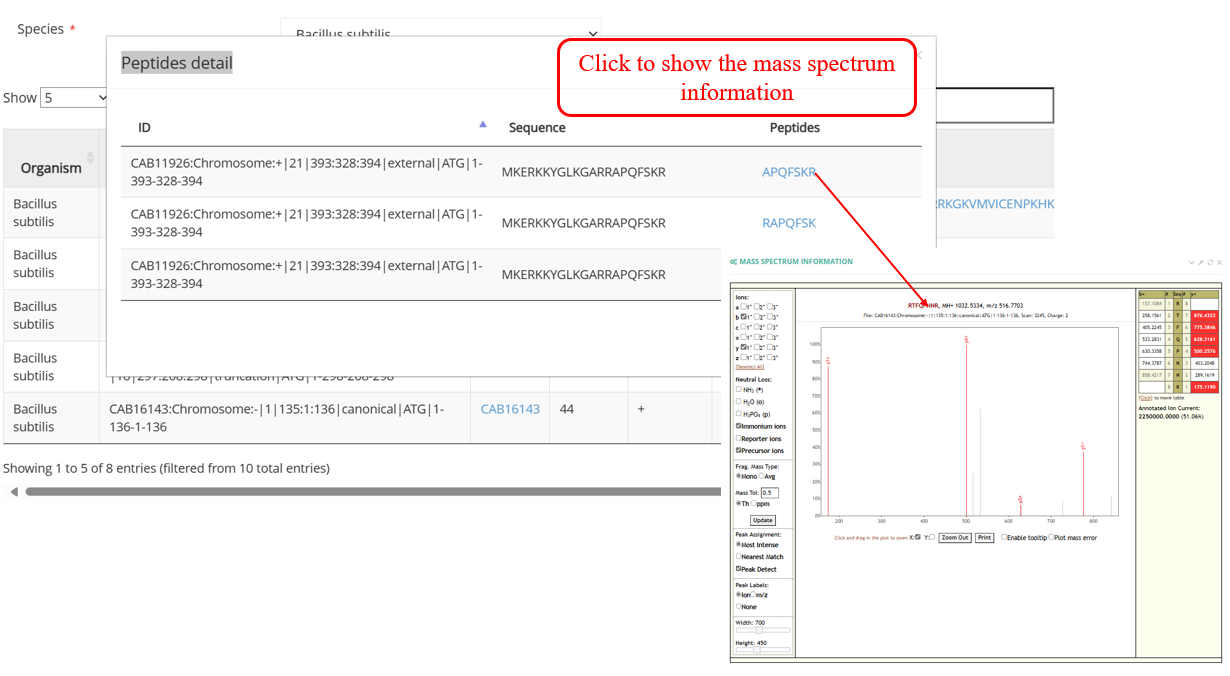
Pepviewer : proteomics displays information related to sORFs: the sORFs are predicted by the RibORF2.0 algorithm, have a length of less than 180 nt, an ORF score greater than 0 and are supported by MaxQuant.
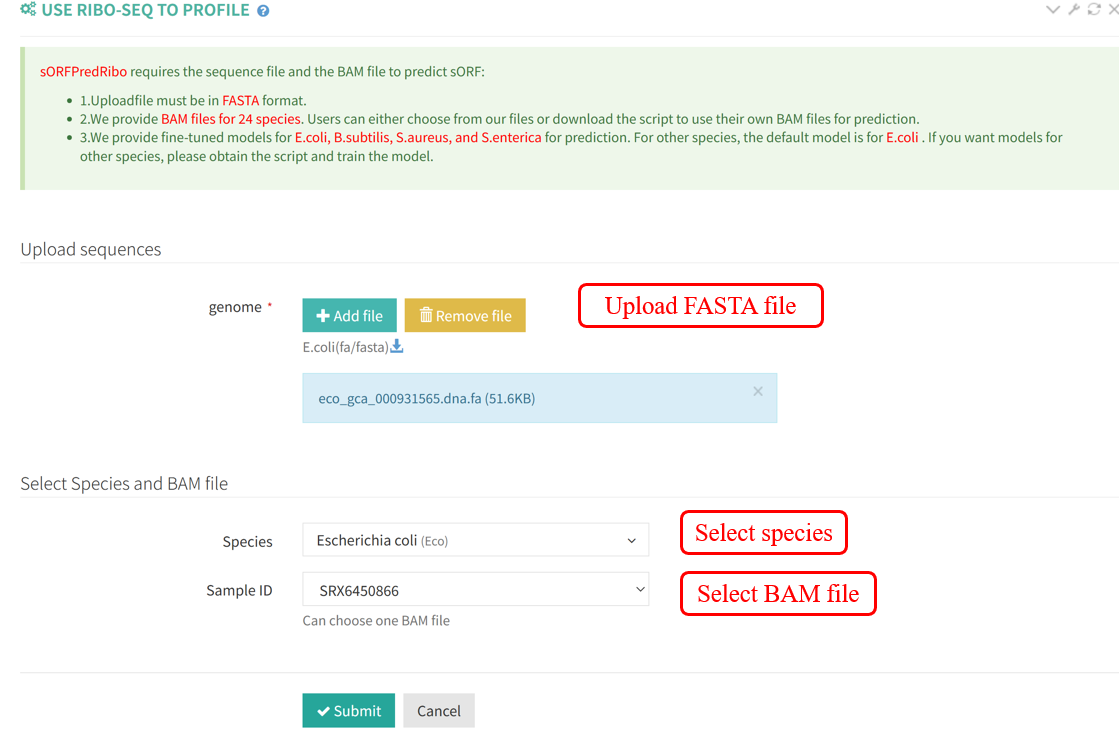
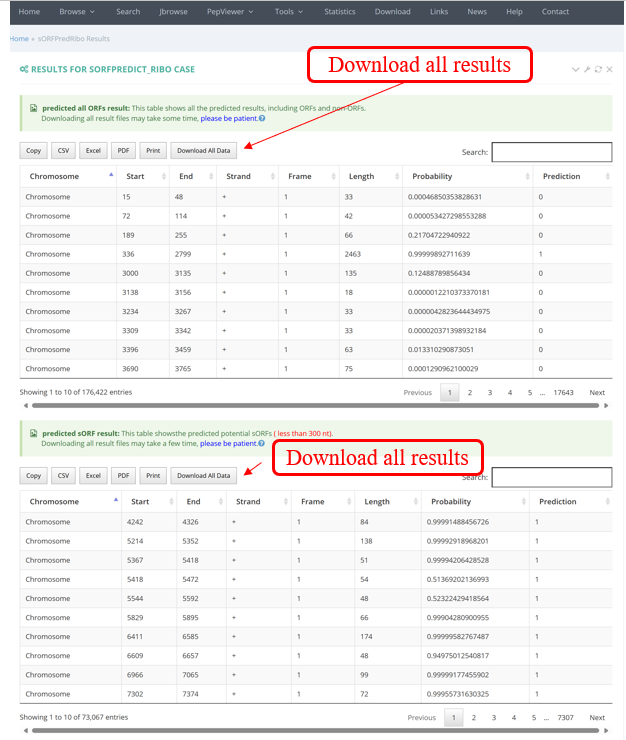
The results of sORFPredRibo are presented in table format, including all results as well as those for sORFs shorter than 300 nt.
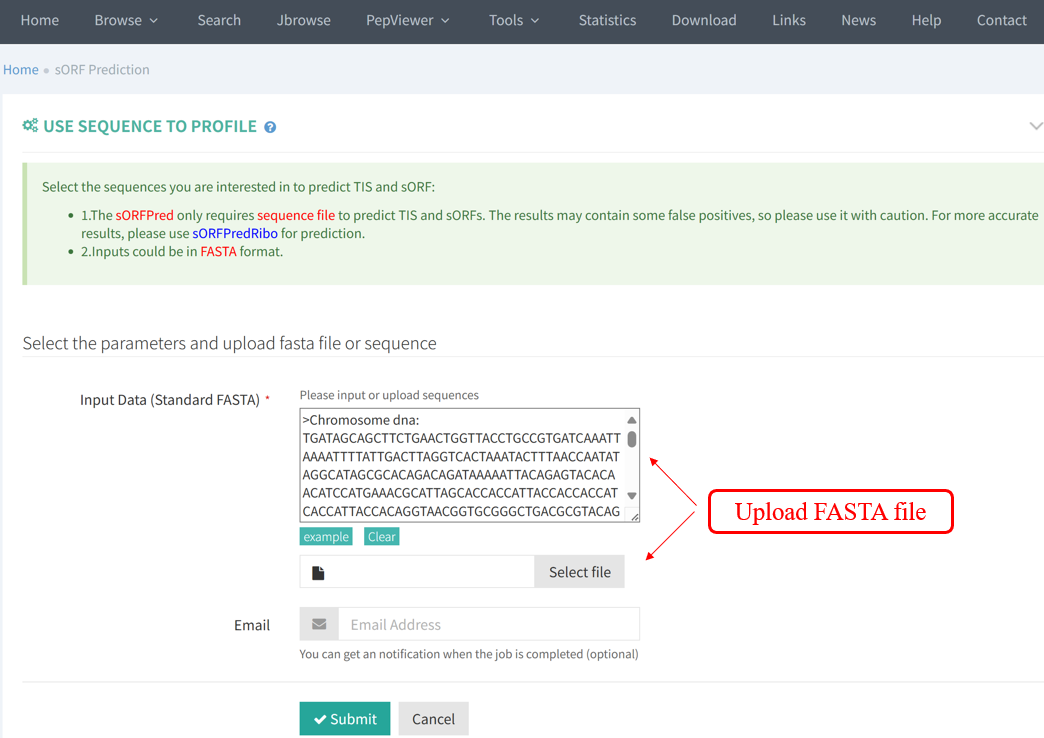
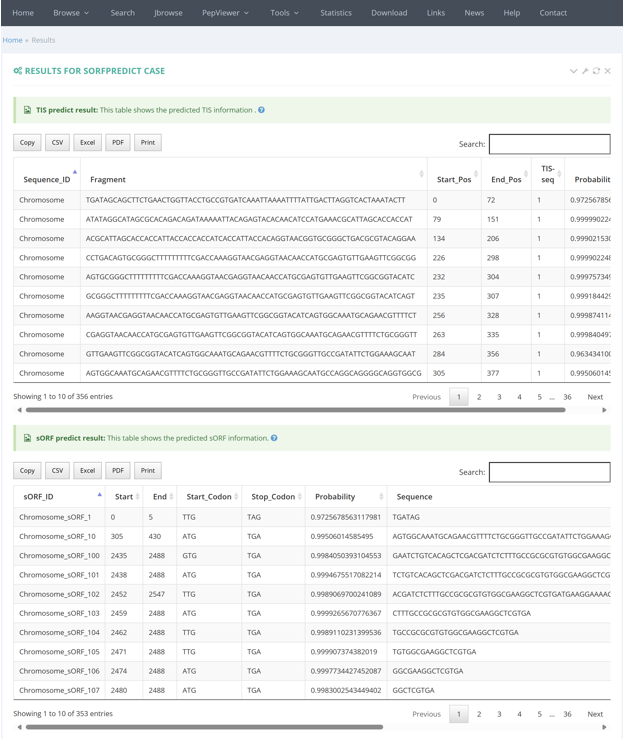
The results of sORFPred are presented in table format, including the predicted TIS information and the predicted sORF information.
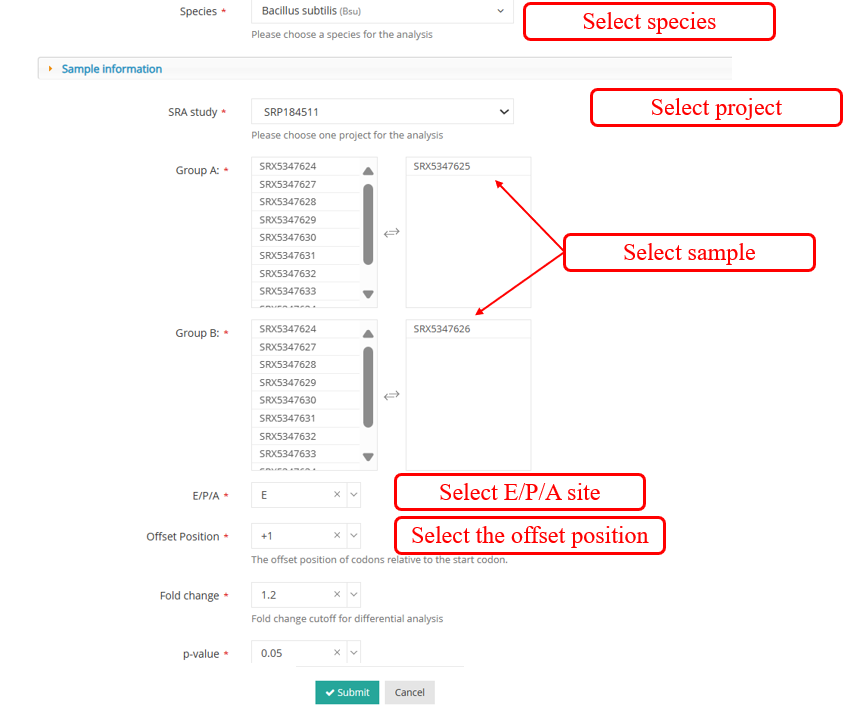
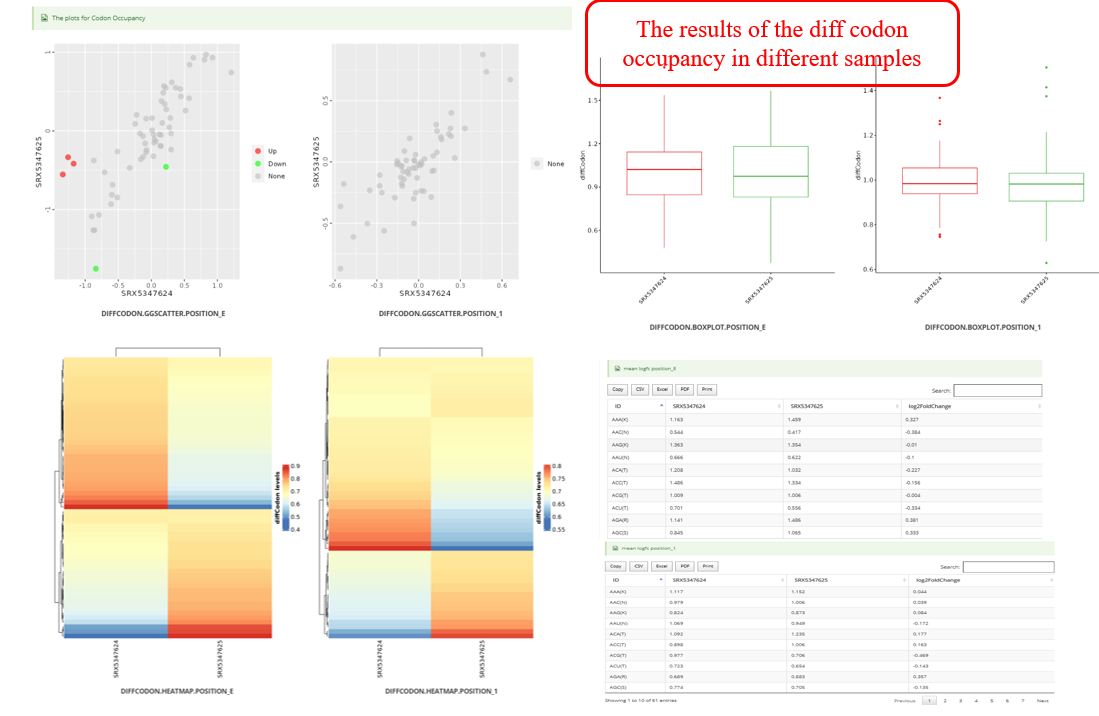
DiffCO :DiffCodon Occupancy is a commonly used metric in genomics and transcriptomics research, reflecting the differences in the frequency of usage of different codons during transcription.Select samples to perform DiffCodon Occupancy analysis.
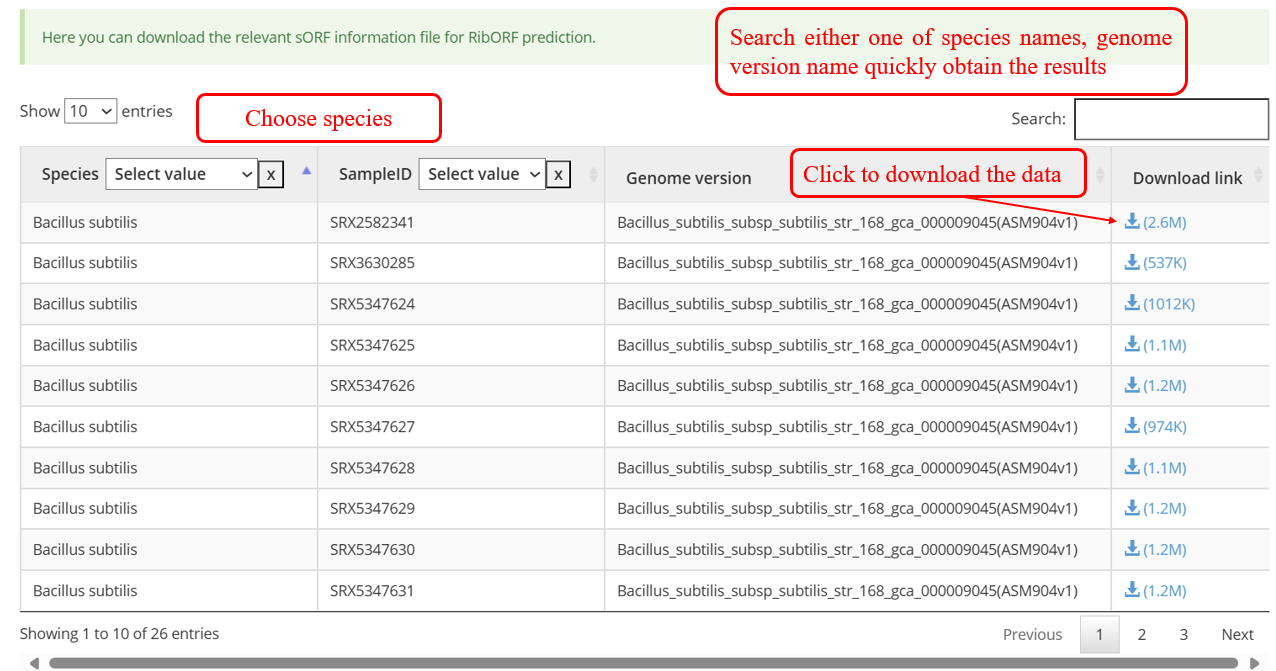
The data files can be freely downloaded and used following the GNU Public License and the license of primary data sources.
Browse of Validated Micropeptides: you can find information about Micropeptides validated in the literature.
Browse by Ribo-seq samples: The below screenshot shows a list of Ribo-seq samples list including the SRA_ID, description retrieved from NCBI database, links to the analysis result, and scientific name of species.
The below screenshot shows an example of the analysis result of a Ribo-seq sample.The ‘Result’ page typically contains the results of quality control for Ribo-seq and sORFs identification.
Browse by geneinfo: The below screenshot shows a list of Ribo-seq samples list including the transcript ID, description retrieved from NCBI database, links to the analysis result, and scientific name of species.
‘Jbrowse’, a comprehensive genomic browser, displays sORFs and their related information with genome coordinates.
Pepviewer : proteomics displays information related to sORFs: the sORFs are predicted by the RibORF2.0 algorithm, have a length of less than 180 nt, an ORF score greater than 0 and are supported by MaxQuant.
The results of sORFPredRibo are presented in table format, including all results as well as those for sORFs shorter than 300 nt.
The results of sORFPred are presented in table format, including the predicted TIS information and the predicted sORF information.
DiffCO :DiffCodon Occupancy is a commonly used metric in genomics and transcriptomics research, reflecting the differences in the frequency of usage of different codons during transcription.Select samples to perform DiffCodon Occupancy analysis.
The data files can be freely downloaded and used following the GNU Public License and the license of primary data sources.