Documents index

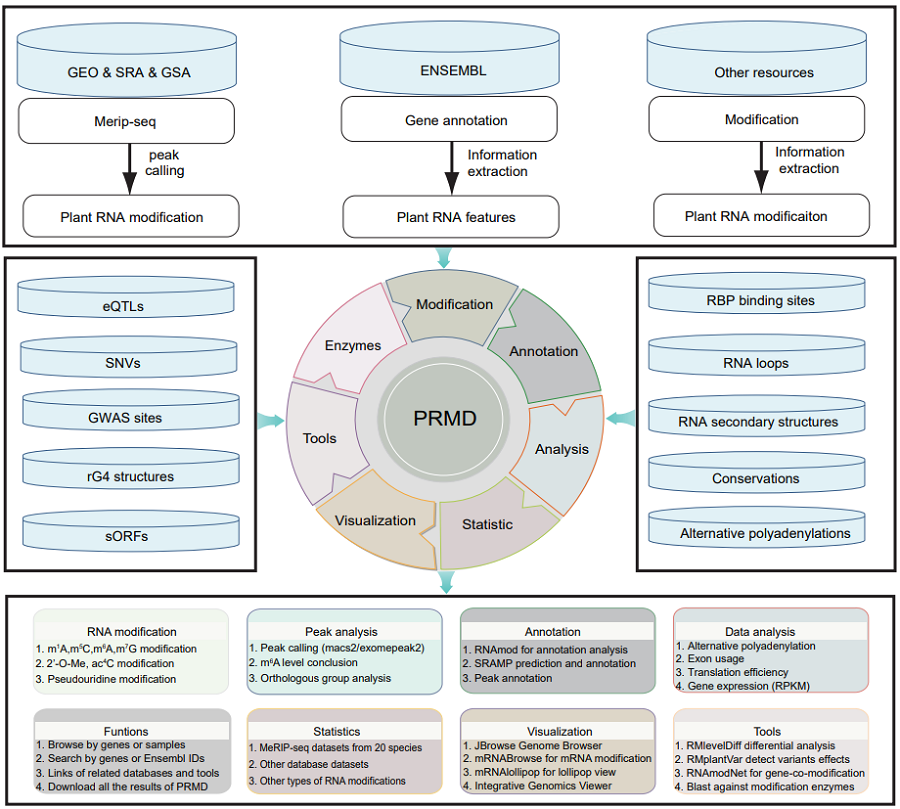
The scheme of PRMD workflow: PRMD provides comprehensive information on RNA modifications. For m6A modifications, a total of 693 MeRIP-seq samples were collected from SRA and GSA databases for 20 plant species. In addition, twelve MeRIP-seq datasets of Oryza rufipogon, Oryza sativa ssp. indica, Oryza sativa ssp. japonica were generated in this study. These MeRIP-seq datasets together with other types of RNA modification datasets and additional related datasets were processed through our uniform pipeline. All results were deposited in a MySQL database and displayed in several convenient web modules on PRMD web pages. Furthermore, we developed several convenient tools in PRMD to facilitate users visualizing the data in the database and choose data or samples to perform further analyses.
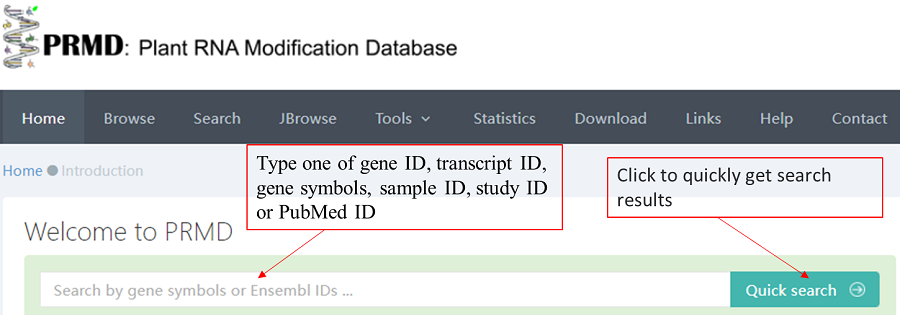
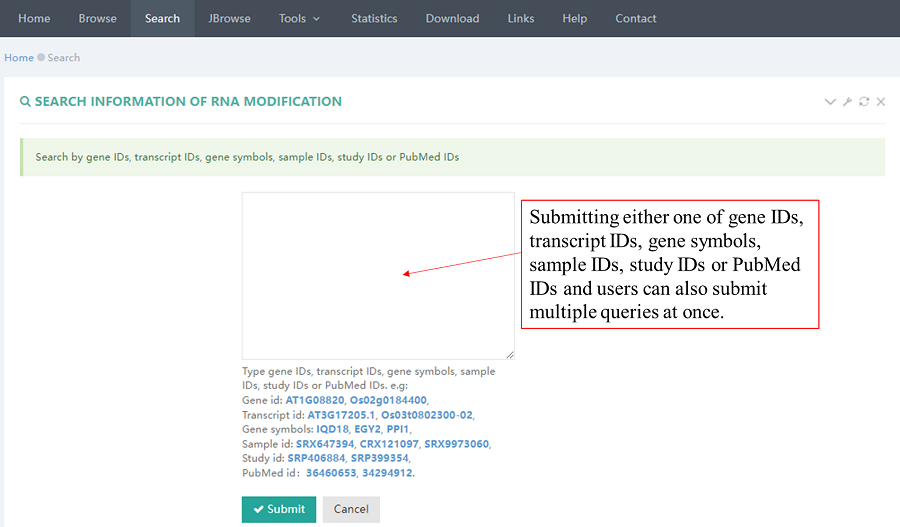
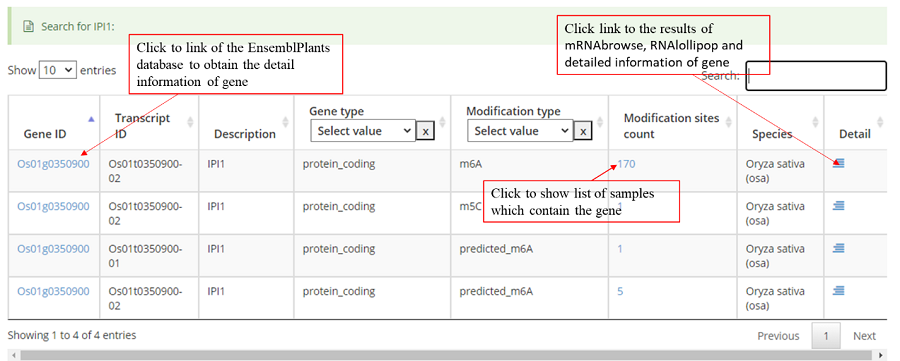
Users can quickly search for the interest gene symbol or Ensembl ID from the homepage. You will see the page shown in the screenshot below. Enter the gene symbol “IPA1" in the Gene/Transcript input box.
The results of the “Search” module in PRMD revealed that this gene contains two transcript names associated with two RNA modification types, m6A and m5C.
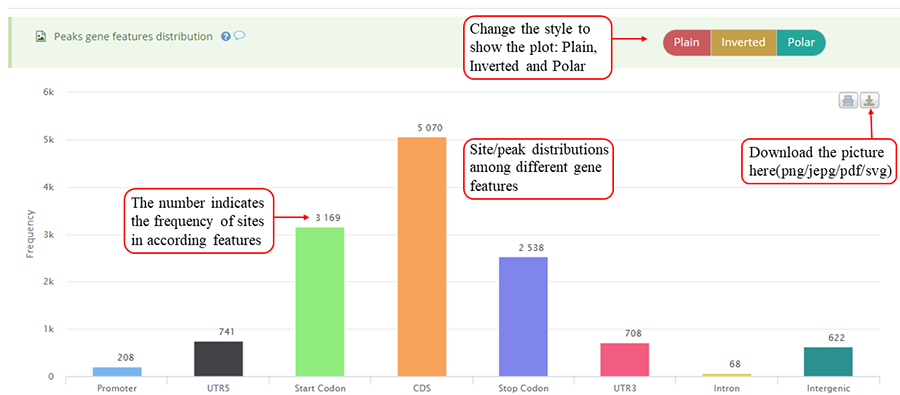
Modification sites/peaks distribution on different gene features, including Promoter, 5'UTR (UTR5), CDS, 3'UTR (UTR3), Stop codon, Intron and Intergenic region. Y-axis denotes the frequency of peaks/sites (number of peaks/sites) while x-axis represents different gene features. The numbers on the bar indicates the frequency of peaks/sites distributed on according gene feature. The plot can be showed in three different forms: 'Plain', 'Inverted' and 'Poplar' and the plot can be exported in png, jpeg, pdf and svg formats. It is noted that the stop codon is overlapped with 3'UTR and CDS.
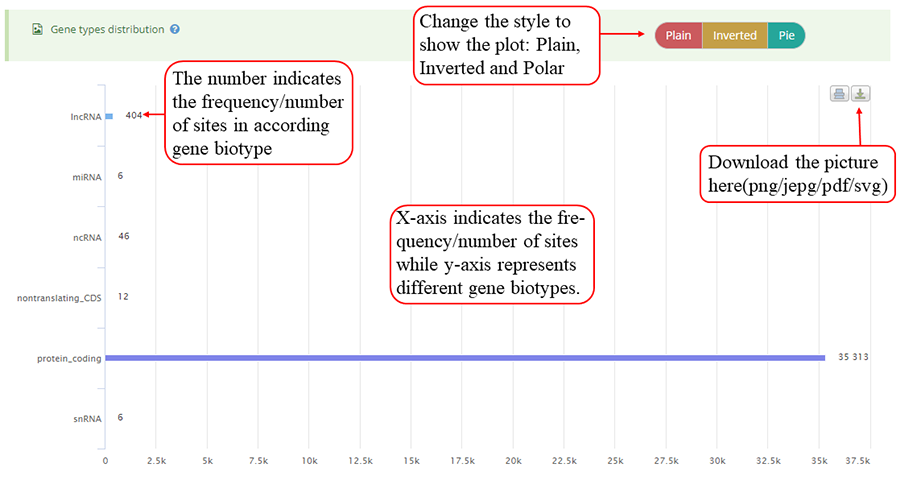
Modification sites/peaks distribution on different gene biotypes, such as protein coding gene, lncRNA, pseudogenes, rRNA, and miRNA. Y-axis indicates the frequency of peaks/sites (number of peaks/sites) while x-axis represents different gene biotypes. The numbers on the bar indicates the frequency of peaks/sites distributed on according gene biotype. The plot can be showed in three different forms: 'Plain', 'Inverted' and 'Pie' and can be downloaded in png, jepg, svg and PDF formats.
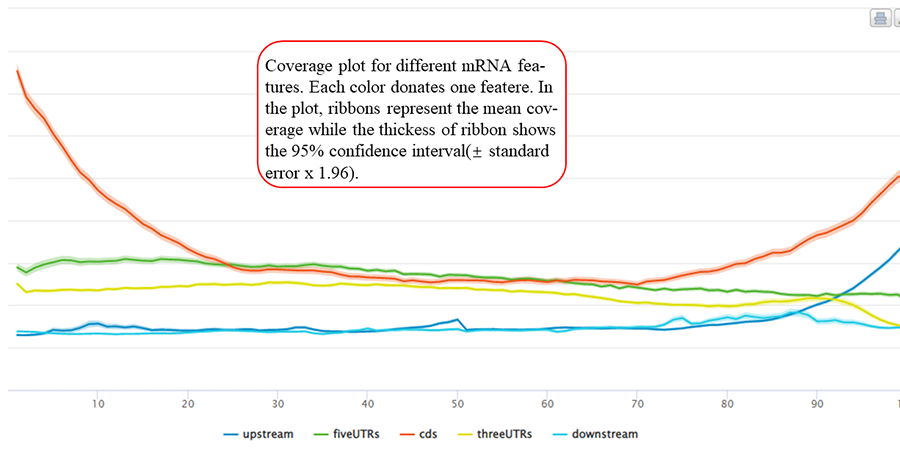
Coverage plot for modification sites/peaks overlapping with different mRNA features. After excluding the features shorter than specific length, each gene feature is divided into bins (100 bins by default) in equal size. The value of the length threshold equals to the number of bins. The number of sites/peaks distributed in each bin is counted and the mean coverage is then calculated among all the according features. X-axis represents the bins (5' → 3' direction) while Y-axis indicates the mean coverage. In the plot, ribbons represent the mean coverage while the thickness of ribbon shows the 95% confidence interval (±standard error x 1.96).
Coverage plot for modification sites/peaks around transcription start sites and translation end sits. The number of site/peaks for each location is counted around the flank regions (upstream and downstream,1000 bp flank size in default). The mean depth of coverage for that location is then calculated for all the genes. X-axis represents the nucleotide location around the site (5' → 3' direction) while Y-axis is the mean depth of coverage. In the plot, ribbons represent the mean coverage while the thickness of ribbon shows the 95% confidence interval (±standard error x 1.96).
Coverage plot for modification sites/peaks around translation start sites (TSS) and translation end sits (TES). The number of site/peaks for each nucleotide location is counted around the flank regions (upstream and downstream) of TSS/TES on the transcript. The mean depth of coverage is then calculated for all the genes. X-axis represents the nucleotide location around the site (5' → 3' direction) while Y-axis is the mean depth of coverage. In the plot, ribbons represent the mean coverage while the thickness of ribbon shows the 95% confidence interval (±standard error x 1.96).
Coverage plot for modification sites/peaks around 5' splice sites and 3' splice sites. For the coverage analysis around splice sites, the number of site/peaks in each location is counted. Then, mean depth coverage for specific location is calculated for all the genes. X-axis represents the nucleotide location around the splice site (5' → 3' direction) while Y-axis indicates the mean depth of coverage. In the plot, ribbons represent the mean coverage while the thickness of ribbon shows the 95% confidence interval (±standard error x 1.96).

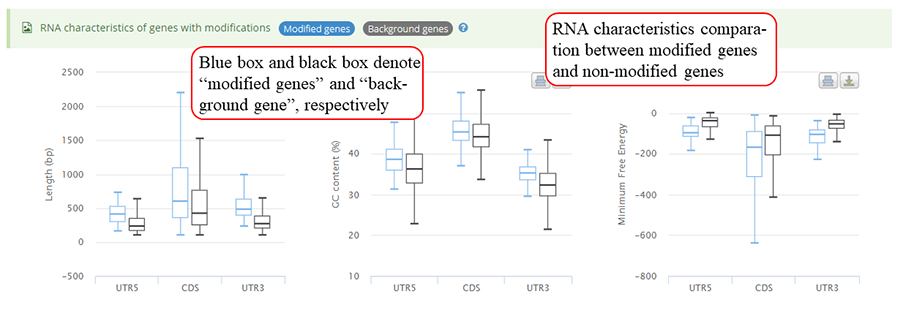
mRNA characteristics statistics between genes with modifications and other background genes. Y-axis in three plots (from left to right) represents length, GC content and minimum free energy (MFE), respectively. The blue bar and black bar represent modified gene and other background genes, respectively.
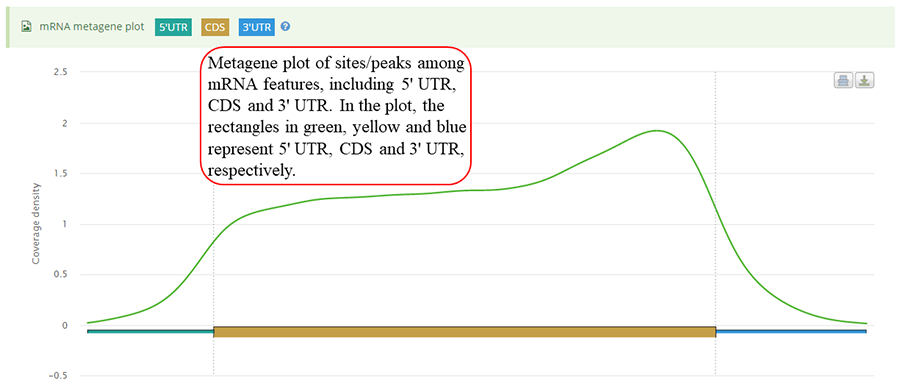
mRNA metagene plot. After excluding the gene with any of the mRNA features (5'UTR, CDS and 3'UTR) shorter than specific length, each mRNA feature was divided into bins with equal size (100 bins by default). The value of the length threshold equals to the number of bins. The number of sites/peaks distributed in each bin is counted. Then,the mean coverage in each bin is calculated among all the genes. The rectangles in green, yellow and blue represent 5'UTR, CDS and 3'UTR, respectively. Y-axis denotes the density distribution of coverages.
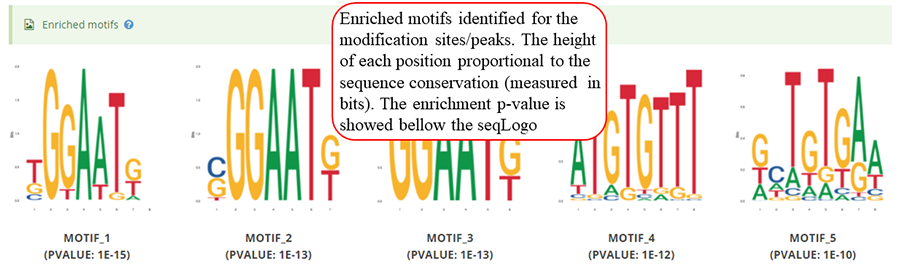
Enriched motifs detect by Homer for the modification sites/peaks. The seqLogo plots for enriched motifs (top 5 as default) are showed, in which, the logo use a stack of letters to represents columns of the alignment and the height of each stack proportional to the sequence conservation (measured in bits) at that position. The enrichment p-value is showed bellow according seqLogo plot.
Heatmap of modification sites/peaks around transcription start sites and transcription end sites (genomic regions). X-axis represents the nucleotide position around the site (5' → 3' direction) while Y-axis represents all modified genes which is sorted by the number of modifications in each gene. In the plot, the red color scale evaluates the depth of coverage.
Heatmap of modification site/peaks among translation start sites and translation end sites (transcriptic regions). X-axis represents the nucleotide position around the site (5' → 3' direction) while Y-axis represents all modified genes which is sorted by the number of modifications in each gene. In the plot, the red color scale evaluates the depth coverages.
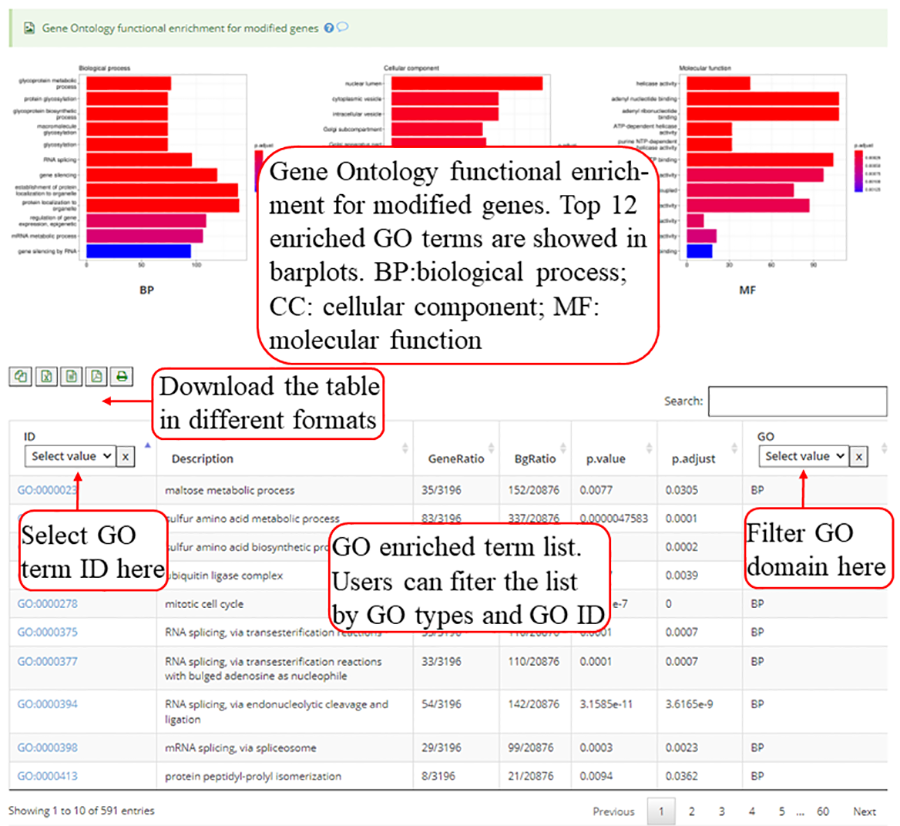
Gene Ontology (GO) functional enrichment for genes with modifications. Top 12 enriched terms are show in the bar plots. Y-axis in the bar plot indicates number of genes in according GO term. The color scale represent the enrichment p-value. All the enriched terms in three GO domains (biological process, cellular component and molecular function) are contained in one table and use filter in 'GO' column to select specific GO domain terms. A blank picture indicates that there is no significant enriched terms for that GO domain.
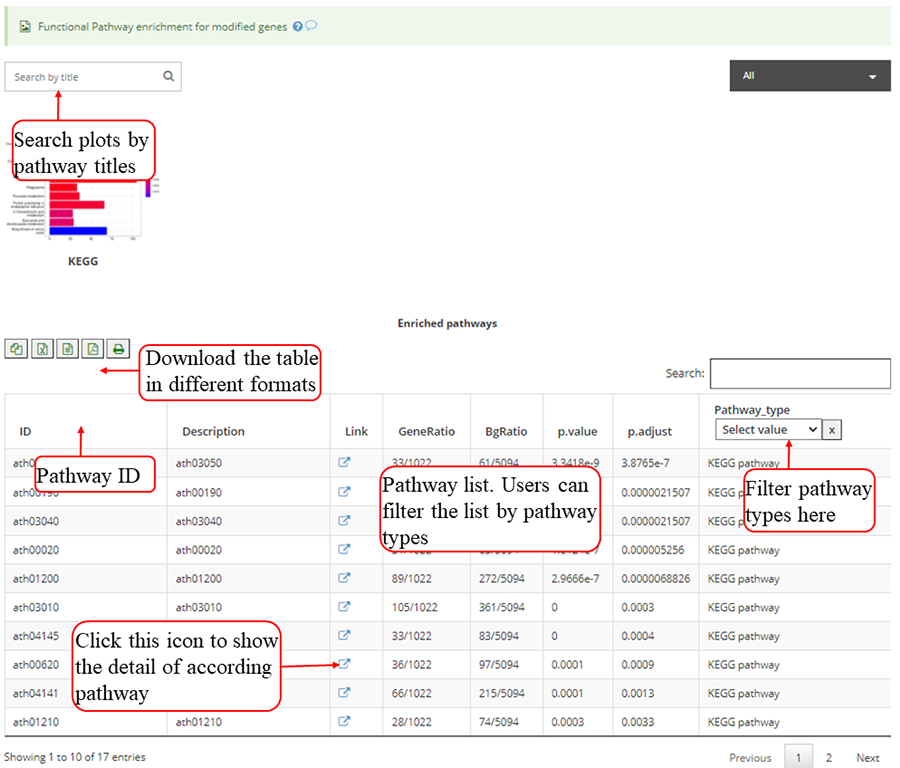
Functional pathway enrichments for genes with modifications, which include KEGG for all 19 species, Top 12 enriched pathways are show in the barplots. Y-axis in the barplot indicates number of genes in according pathway category. The color scale represent the enrichment p-value. All the enriched pathway in different pathways are contained in one table and use filter in 'Type' column to select specific pathway. If there is no data for specific pathway category, there will be no picture for that pathway. Beside, a blank picture indicates that there is no significant enriched pathway for that pathway category.
The detail list of genes containing modification sites/peaks. The gene information include transcript ID, gene symbol and gene biotype (gene_type). It is note that 'Stop codon' region is overlapped with 3'UTR and CDS. Click icon to compare the modifications in these genes with known modifications and RBP binding sites in JBrowse and click the transcript_ID to show the detailed gene information in Ensembl database.

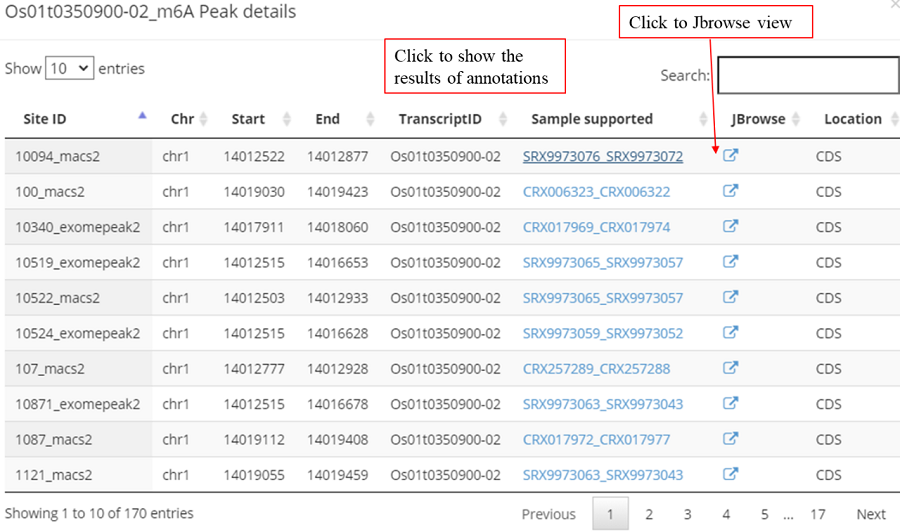
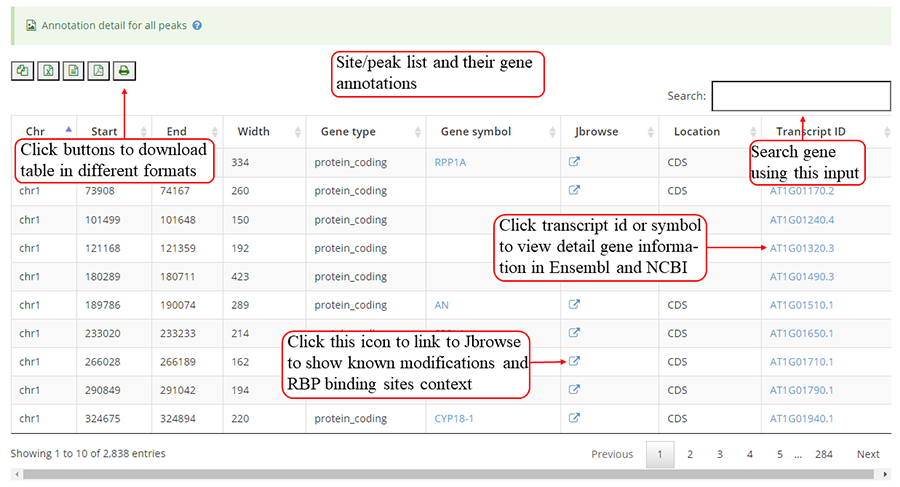
Detail annotation list of sites/peaks. The gene information for the peak include transcript ID, gene symbol, gene biotype (gene_type) and location on according gene. Click icon to compare the modification with other known modifications and RBP binding sites in JBrowse while click the transcript_ID to show the detailed gene information in Ensembl database.
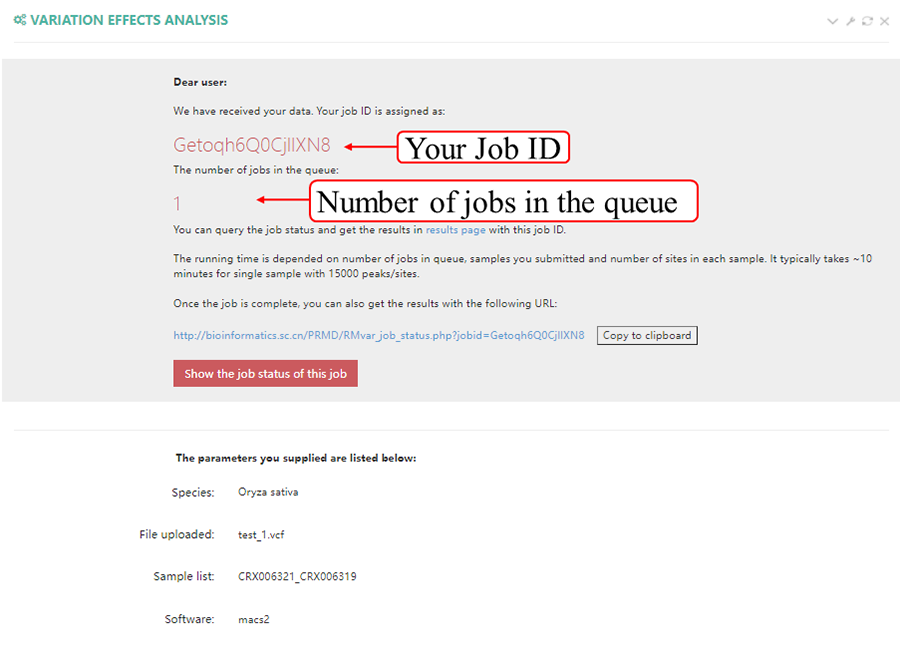
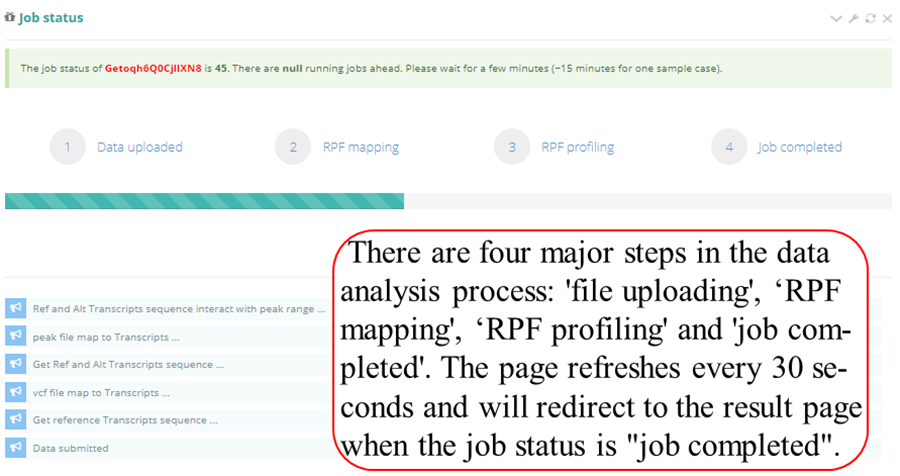
After job is submitted, the web server will give the user a Job ID, and display the running progressing.
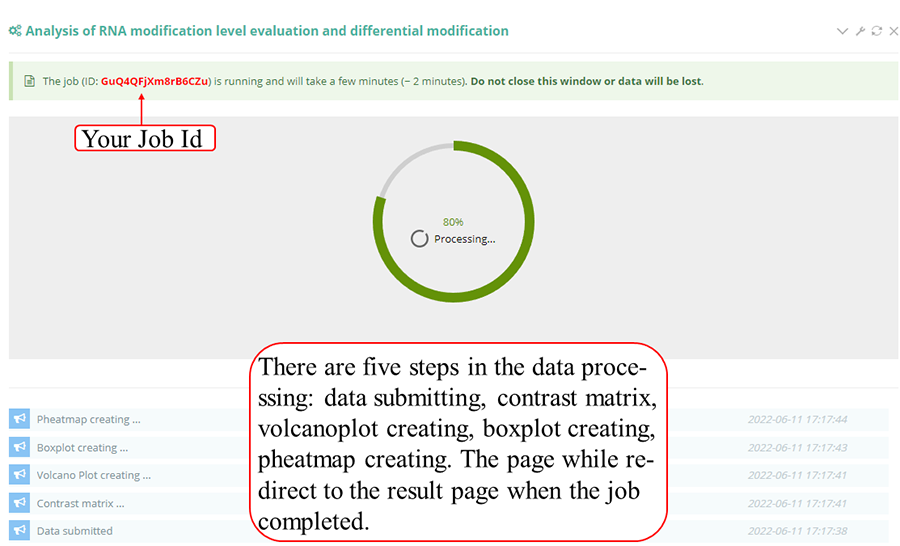
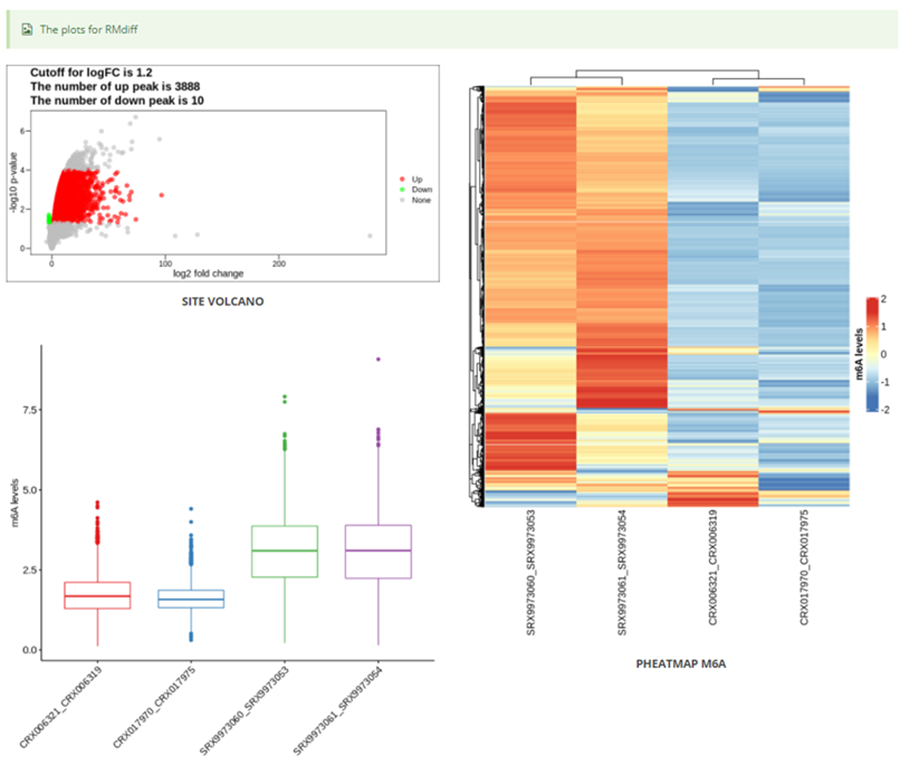
The page while redirect to the result page when the job completed. In volcano plot, each point represents a site/peak, red represents up-regulated peak and green represents down-regulated peak according to cutoff giving by users. X-axis represents log2 fold change, Y-axis represents –log10(p-value). In box plot, X-axis represents samples, Y-axis represents log2(m6A levels + 1). In heatmap, X-axis represents the samples, Y-axis represents all modified sites/peaks which is clusterd by the m6A modification levels.
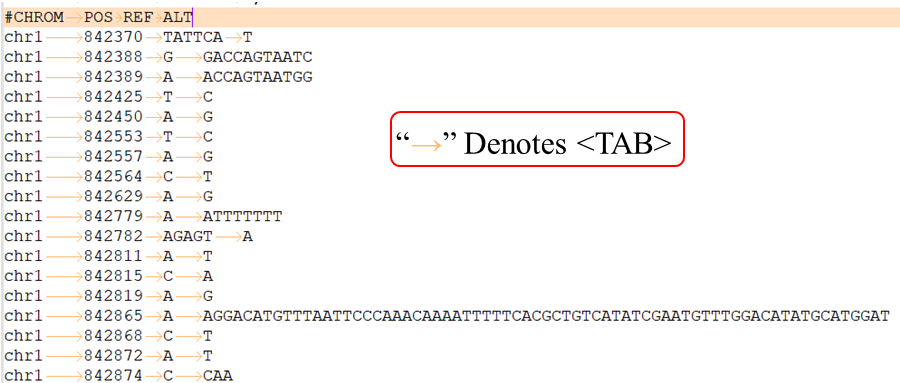
VCF lines have four required fields:
CHROM - chromosome: An identifier from the reference genome or an angle-bracketed ID String ("< ID >") pointing to a contig in the assembly file (cf. the ##assembly line in the header). All entries for a specific CHROM should form a contiguous block within the VCF file. (String, no whitespace permitted, Required).
POS - position: The reference position, with the 1st base having position 1. Positions are sorted numerically, in increasing order, within each reference sequence CHROM. It is permitted to have multiple records with the same POS. Telomeres are indicated by using positions 0 or N+1, where N is the length of the corresponding chromosome or contig. (Integer, Required).
REF - reference base(s): Each base must be one of A,C,G,T,N (case insensitive). Multiple bases are permitted. The value in the POS field refers to the position of the first base in the String. For simple insertions and deletions in which either the REF or one of the ALT alleles would otherwise be null/empty, the REF and ALT Strings must include the base before the event (which must be reflected in the POS field), unless the event occurs at position 1 on the contig in which case it must include the base after the event; this padding base is not required (although it is permitted) for e.g. complex substitutions or other events where all alleles have at least one base represented in their Strings. If any of the ALT alleles is a symbolic allele (an angle-bracketed ID String "< ID >") then the padding base is required and POS denotes the coordinate of the base preceding the polymorphism. Tools processing VCF files are not required to preserve case in the allele Strings. (String, Required).
ALT - alternate base(s): Comma separated list of alternate non-reference alleles. These alleles do not have to be called in any of the samples. Options are base Strings made up of the bases A,C,G,T,N,*, (case insensitive) or an angle-bracketed ID String ("< ID >") or a breakend replacement string as described in the section on breakends. The ‘*’ allele is reserved to indicate that the allele is missing due to a upstream deletion. If there are no alternative alleles, then the missing value should be used. Tools processing VCF files are not required to preserve case in the allele String, except for IDs, which are case sensitive. (String; no whitespace, commas, or angle-brackets are permitted in the ID String itself).
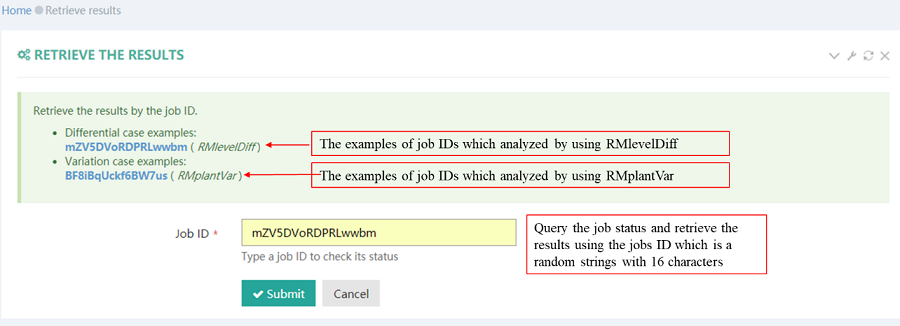
After job is submitted, the web server will give the user a Job ID, which can be used to retrieve the results.
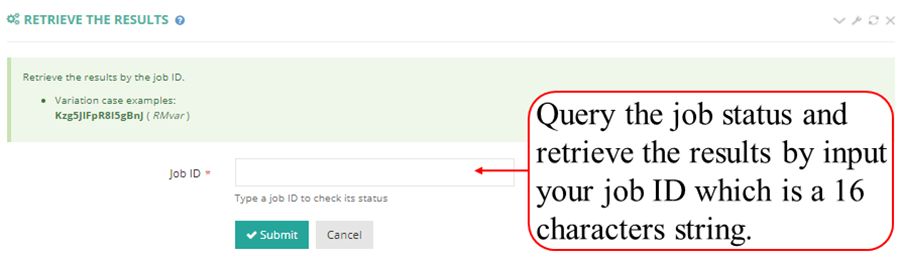
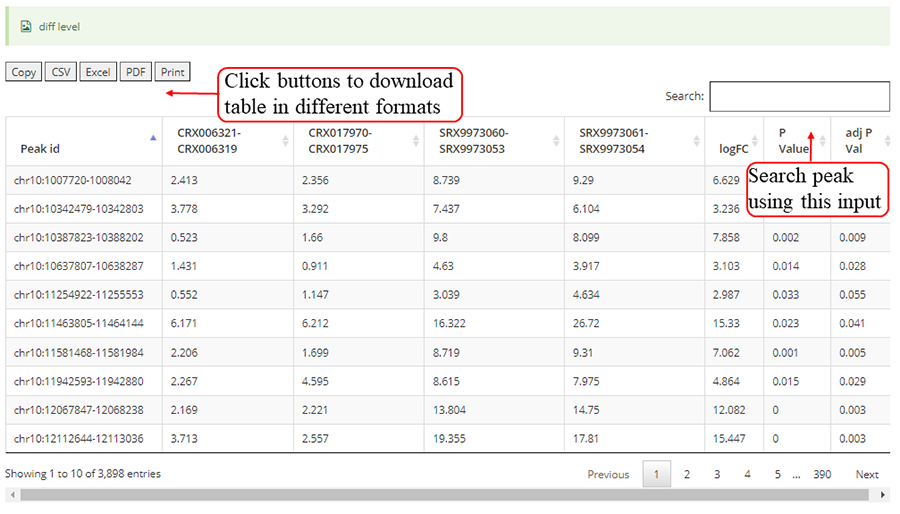
Query the job status. There are four major steps in the data analysis process: RPF mapping', ‘RPF profiling' and 'job completed'. The page refreshes every 30 seconds and will redirect to the result page when the job status is "job completed". In result pages, all the results are showed in high-quality interactive figures and tables. The figures generated by highcharts.js can be downloaded in PNG, JPG, PDF and SVG formats while the table formated by DataTables.js can be download in CSV, Excel and PDF formats.
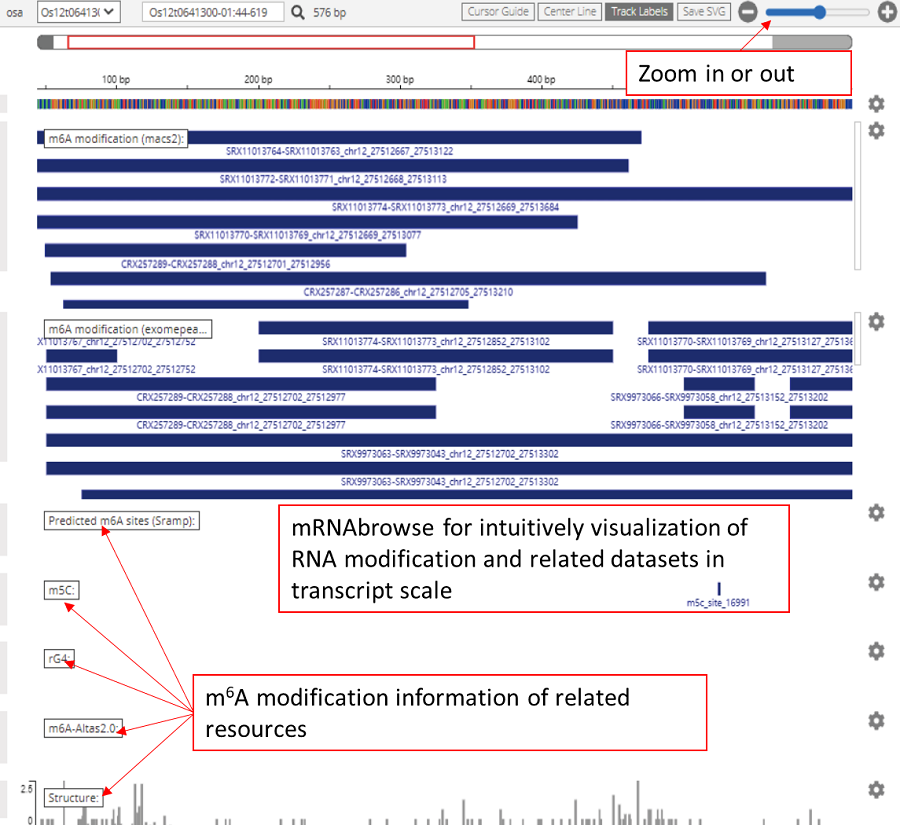
The mRNAbrowse designed for transcript-scale mRNA modification visualization based on IGV.js (https://github.com/igvteam/igv.js), intuitively displayed our RNA modification results and the additional related datasets in transcript scale including nanopore-seq, conservation, GWAS sites, miCLIP-seq, miRNA cleavage, alternative polyadenylation sites, RBP binding sites, RNA secondary structures, alternative polyadenylation sites, RNA G-quadruplex structures, R-loop atlas, small ORFs and other modification files.
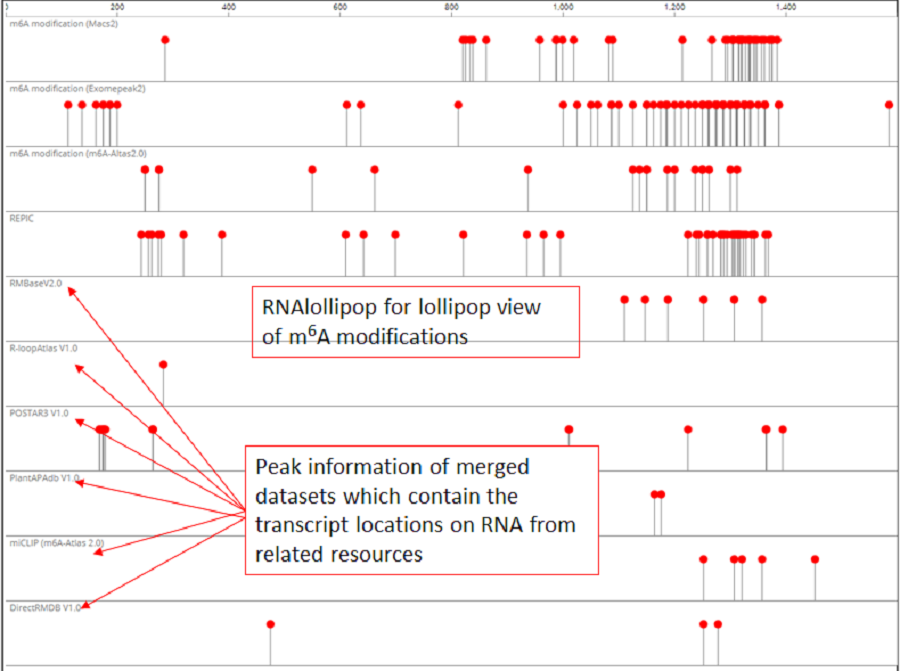
RNAlollipop was designed for the lollipop view of modification on RNA (only the nonempty tracks are shown) in PRMD. We merged all the datasets which contain the transcript locations by species, so users can directly compare the differences in RNA modification with other elements from different sources under the same location , RNAlollipop was automatically loaded to display the locations along with transcript coordinates of RNA modification sites and related information in the “Browse” module interface.
Jbrowse is used to show the known modification sites and related data sites. The tracks are organized into three groups: basic genome information tracks, RNA modification tracks and RBP binding-site tracks. The track of user's modification are showed automatically and click the checkbox in left window to show other tracks. Meanwhile, the tracks can be searched by inputing the modification type or RBP name.
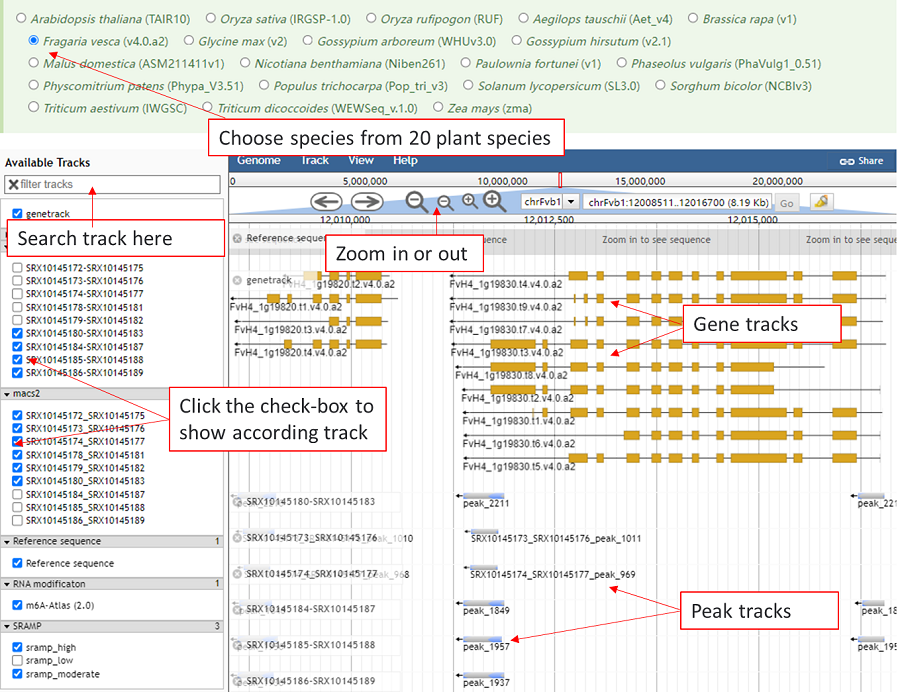
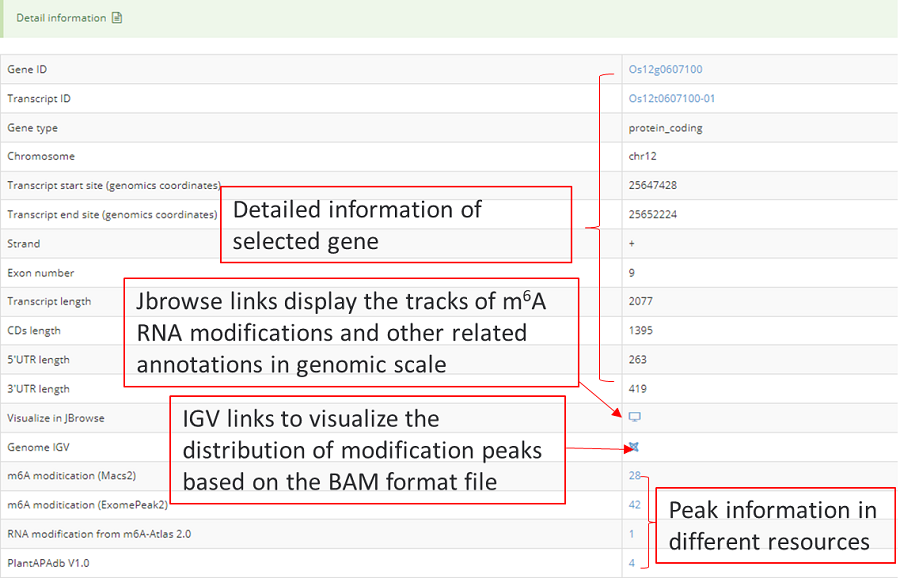
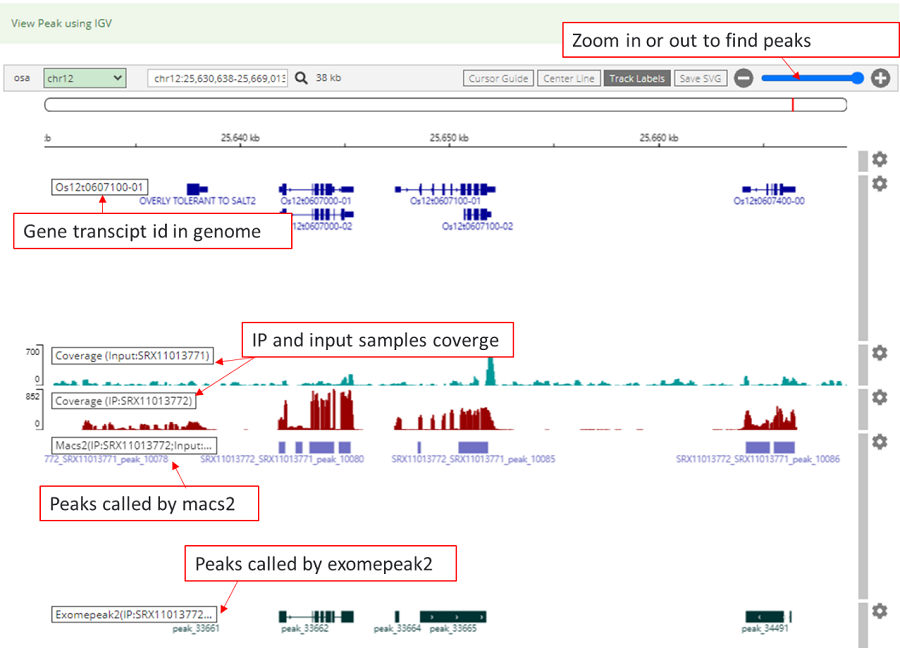
The Integrative Genomics Viewer (IGV), which located in detail information under the view of mRNAbrowse and RNAlollipop, was integrated to visualize variations in the genome. Users can intuitively view the coverage of different samples and the abundance of peaks which called by macs2 and exomepeak2.
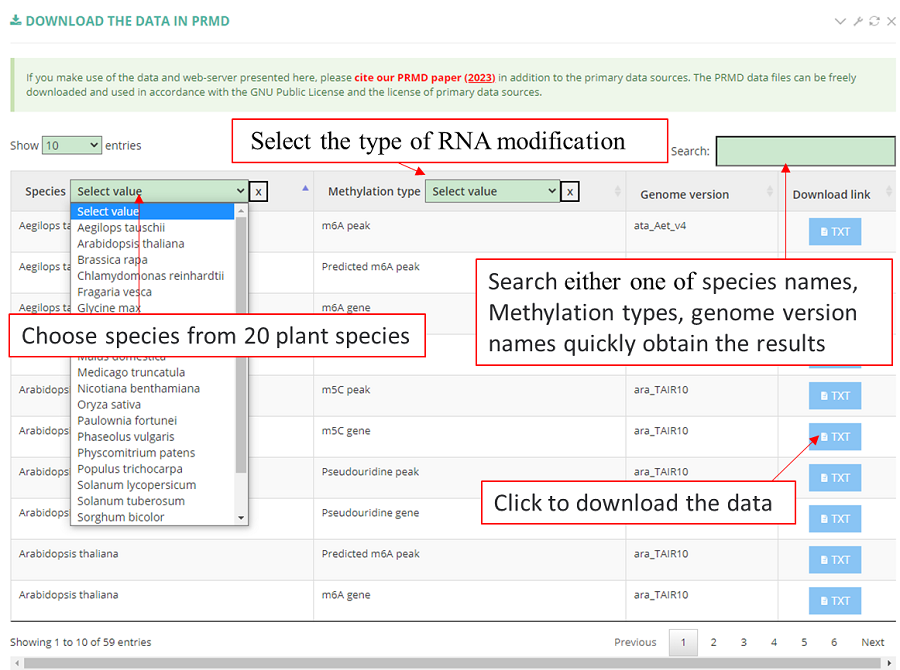
The PRMD data files can be freely downloaded and used in accordance with the GNU Public License and the license of primary data sources.